Albumentations物体検出データ拡張
目次
概要
Albumentationsライブラリを用いた物体検出用データ拡張技術を実装・体験する。データ拡張とは、既存の訓練データに変換処理を施して人工的にデータ量を増加させる手法である。
主要技術:Albumentations(画像拡張ライブラリ)
本プログラムでは、Albumentationsライブラリを使用してサンプル画像に対して複数の変換手法を組み合わせたデータ拡張を実行する。幾何学的変換(回転、スケール、平行移動)、色彩変換(明度、コントラスト調整)、ノイズ追加などの処理を適用し、バウンディングボックス座標を変換に合わせて自動調整する。拡張前後の画像とバウンディングボックスの変化を可視化することで、データ拡張の効果を確認できる。
論文:Buslaev, A., Iglovikov, V. I., Khvedchenya, E., Parinov, A., Druzhinin, M., & Kalinin, A. A. (2020). Albumentations: Fast and Flexible Image Augmentations. Information, 11(2), 125. https://doi.org/10.3390/info11020125
新規性・特徴:
- バウンディングボックス座標の自動変換機能(従来は手動調整が必要)
- 高速な処理性能と高品質な拡張機能
- 多様な変換手法の組み合わせ対応
特徴を活かせるアプリ例: 自動運転での物体認識、監視カメラでの異常検知、医用画像での病変検出
体験価値: データ拡張による物体検出精度向上の確認、バウンディングボックス座標変換の自動化の体験、変換手法の組み合わせ効果の観察
事前準備
Python 3.12 のインストール
Pythonのインストールを行い、Pythonのプログラムを実行する環境を整える。扱う環境は、Windows搭載パソコンである。金子研究室では、Python 3.12.10を推奨する。
[Windows での Python 3.12 のインストール手順を見るには、ここをクリック]
Windows での Python 3.12 のインストール
以下のいずれかの方法でPython 3.12をインストールする。Pythonがインストール済みの場合、この手順は不要である。
方法 1:winget によるインストール
【インストールコマンドの実行方法】
管理者権限でコマンドプロンプトを起動する(手順:Windowsキーまたはスタートメニュー → cmd と入力 → 右クリック → 「管理者として実行」)。そして、コマンド全体をコマンドプロンプトにコピー&ペーストする。
--scope machine を指定することで、システム全体(全ユーザー向け)にインストールされる。このオプションの実行には管理者権限が必要である。インストール完了後、コマンドプロンプトを再起動するとPATHが反映される。
REM Python 3.12 をシステム領域にインストール
winget install --id Python.Python.3.12 -e --scope machine --silent --accept-source-agreements --accept-package-agreements --override "/quiet InstallAllUsers=1 PrependPath=1 Include_test=0 Include_pip=1 Include_launcher=1 InstallLauncherAllUsers=1 TargetDir=\"C:\Program Files\Python312\""

REM Python と Scripts を PATH 先頭に追加
powershell -NoProfile -Command "$p='C:\Program Files\Python312'; $s=\"$p\Scripts\"; $c=[Environment]::GetEnvironmentVariable('Path','Machine'); if((Test-Path $p) -and (';'+$c+';' -notlike \"*;$p;*\") -and (';'+$c+';' -notlike \"*;$s;*\")){[Environment]::SetEnvironmentVariable('Path',\"$p;$s;$c\",'Machine')}"
方法 2:インストーラーによるインストール
- Python公式サイト(https://www.python.org/downloads/)にアクセスし、「Download Python 3.x.x」ボタンからWindows用インストーラーをダウンロードする。
- ダウンロードしたインストーラーを実行する。
- 初期画面の下部に表示される「Add python.exe to PATH」にチェックを入れてから「Customize installation」を選択する。このチェックを入れ忘れると、コマンドプロンプトから
pythonコマンドを実行できない。 - 「Install Python 3.xx for all users」にチェックを入れ、「Install」をクリックする。
インストールの確認
コマンドプロンプトで以下を実行する。
python --versionバージョン番号(例:Python 3.12.x)が表示されればインストール成功である。「'python' は、内部コマンドまたは外部コマンドとして認識されていません。」と表示される場合は、インストールが正常に完了していない。
Python の開発環境 Visual Studio Code のインストールと Python 用の設定
Python の開発環境Visual Studio Code(プログラムを編集するソフトウェア。以下、VS Code)を整える。
[Windows での Visual Studio Code のインストールと Python 用の設定手順を見るには、ここをクリック]
Windows での Visual Studio Code のインストールと Python 用の設定手順
1. VS Code と拡張機能のインストール
以下のコマンドにより,既存の VS Code を削除し,全ユーザー共有の設定で再インストールしたうえで,拡張機能(VS Code に機能を追加するソフトウェア)をまとめて導入する.
【インストールコマンドの実行方法】
管理者権限でコマンドプロンプトを起動する(手順:Windows キーまたはスタートメニュー → cmd と入力 → 右クリック → 「管理者として実行」)。そして,コマンド全体をコマンドプロンプトにコピー&ペーストする。
インストールコマンド
REM ============================================================
REM Microsoft Visual Studio Code
REM ============================================================
winget uninstall -e --id Microsoft.VisualStudioCode --silent --disable-interactivity --accept-source-agreements
rmdir /s /q C:\ProgramData\vscode-extensions 2>nul
rmdir /s /q "%APPDATA%\Code" 2>nul
rmdir /s /q "%USERPROFILE%\.vscode" 2>nul
rmdir /s /q "%LOCALAPPDATA%\Microsoft\vscode-update" 2>nul

REM VS Code をシステム領域に新規インストール
winget install --scope machine --id Microsoft.VisualStudioCode -e --silent --accept-source-agreements --accept-package-agreements

REM 全ユーザー共有の拡張機能フォルダ
mkdir C:\ProgramData\vscode-extensions 2>nul
icacls "C:\ProgramData\vscode-extensions" /grant "Everyone:(OI)(CI)M" /T

REM スタートメニューのショートカットを --extensions-dir 付きで再作成
rmdir /s /q "C:\ProgramData\Microsoft\Windows\Start Menu\Programs\Visual Studio Code" 2>nul
del "C:\ProgramData\Microsoft\Windows\Start Menu\Programs\Visual Studio Code.lnk" 2>nul
powershell -NoProfile -Command "$s=New-Object -ComObject WScript.Shell; $lnk=$s.CreateShortcut('C:\ProgramData\Microsoft\Windows\Start Menu\Programs\Visual Studio Code.lnk'); $lnk.TargetPath='C:\Program Files\Microsoft VS Code\Code.exe'; $lnk.Arguments='--extensions-dir \"C:\ProgramData\vscode-extensions\"'; $lnk.Save()"
REM ショートカットの検証
powershell -NoProfile -Command "$s=New-Object -ComObject WScript.Shell; $lnk=$s.CreateShortcut('C:\ProgramData\Microsoft\Windows\Start Menu\Programs\Visual Studio Code.lnk'); Write-Host 'TargetPath:' $lnk.TargetPath; Write-Host 'Arguments:' $lnk.Arguments"

REM ファイル / フォルダ右クリックの「Code で開く」を登録
reg add "HKLM\SOFTWARE\Classes\*\shell\VSCode\command" /ve /d "\"C:\Program Files\Microsoft VS Code\Code.exe\" --extensions-dir \"C:\ProgramData\vscode-extensions\" \"%1\"" /f
reg add "HKLM\SOFTWARE\Classes\Directory\shell\VSCode\command" /ve /d "\"C:\Program Files\Microsoft VS Code\Code.exe\" --extensions-dir \"C:\ProgramData\vscode-extensions\" \"%1\"" /f
reg add "HKLM\SOFTWARE\Classes\Directory\Background\shell\VSCode\command" /ve /d "\"C:\Program Files\Microsoft VS Code\Code.exe\" --extensions-dir \"C:\ProgramData\vscode-extensions\" \"%V\"" /f

REM --extensions-dir 付きで起動する code.cmd ラッパを作成
REM (%* を echo で書くと対話的 cmd で失われるため、PowerShell で [char]37+'*' を書き出す)
powershell -NoProfile -Command "$pct=[char]37; $q=[char]34; $c='@echo off'+[char]13+[char]10+$q+'C:\Program Files\Microsoft VS Code\bin\code.cmd'+$q+' --extensions-dir '+$q+'C:\ProgramData\vscode-extensions'+$q+' '+$pct+'*'+[char]13+[char]10; [IO.File]::WriteAllText('C:\ProgramData\vscode-extensions\vscode.cmd',$c,[Text.Encoding]::ASCII)"

REM 拡張機能のインストール
set "CODE=C:\Program Files\Microsoft VS Code\bin\code.cmd"
"%CODE%" --extensions-dir "C:\ProgramData\vscode-extensions" --uninstall-extension GitHub.copilot
"%CODE%" --extensions-dir "C:\ProgramData\vscode-extensions" --uninstall-extension GitHub.copilot-chat
"%CODE%" --extensions-dir "C:\ProgramData\vscode-extensions" --install-extension ms-python.python
"%CODE%" --extensions-dir "C:\ProgramData\vscode-extensions" --install-extension ms-python.vscode-pylance
"%CODE%" --extensions-dir "C:\ProgramData\vscode-extensions" --install-extension ms-python.debugpy
"%CODE%" --extensions-dir "C:\ProgramData\vscode-extensions" --install-extension MS-CEINTL.vscode-language-pack-ja
"%CODE%" --extensions-dir "C:\ProgramData\vscode-extensions" --install-extension saoudrizwan.claude-dev
"%CODE%" --extensions-dir "C:\ProgramData\vscode-extensions" --install-extension rust-lang.rust-analyzer
"%CODE%" --extensions-dir "C:\ProgramData\vscode-extensions" --install-extension tamasfe.even-better-toml
"%CODE%" --extensions-dir "C:\ProgramData\vscode-extensions" --install-extension anthropic.claude-code
"%CODE%" --extensions-dir "C:\ProgramData\vscode-extensions" --install-extension almenon.arepl
"%CODE%" --extensions-dir "C:\ProgramData\vscode-extensions" --list-extensions --show-versions
echo === セットアップ完了 ===
2. Python インタプリタの選択
同一マシンに複数の Python がインストールされている場合,VS Code で使用する Python 本体(インタプリタ:Python プログラムを解釈・実行するソフトウェア)を選択する必要がある.
- コマンドパレット(コマンド名で機能を呼び出す VS Code の入力欄)を開く(
Ctrl+Shift+P) Python: Select Interpreterと入力する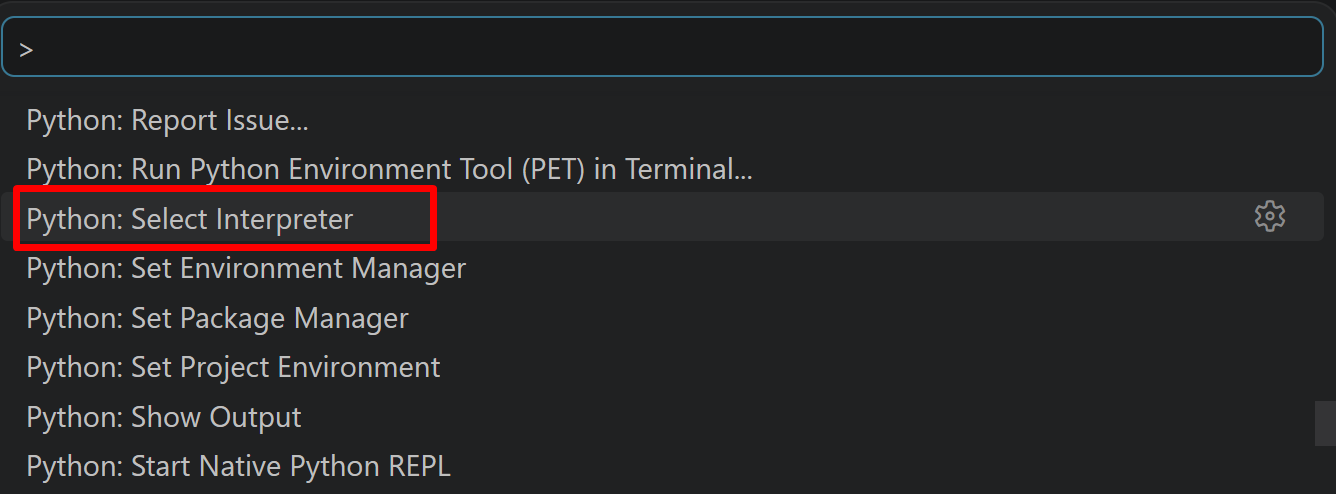
- 表示される一覧から,使用する Python(例:
C:\Program Files\Python312\python.exe)を選択する.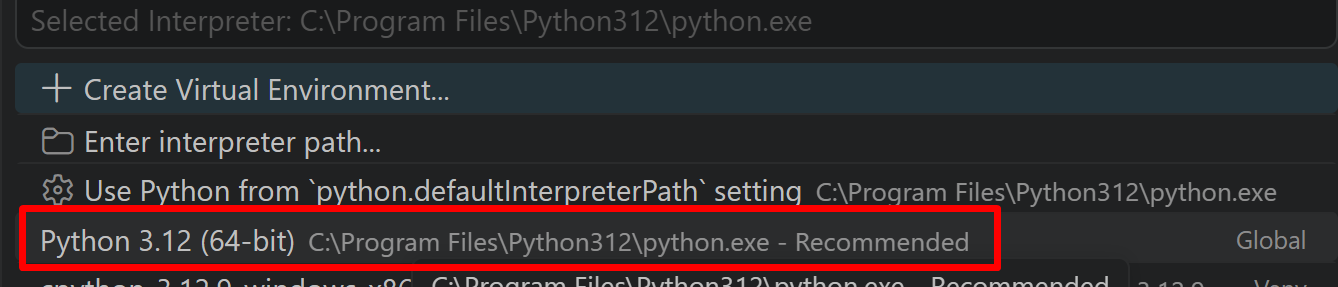
必要ライブラリのインストール。コマンドプロンプトを管理者として実行(手順:Windowsキーまたはスタートメニュー > cmd と入力 > 右クリック > 「管理者として実行」)し、以下を実行する。
pip install albumentations opencv-python matplotlib numpy japanize-matplotlib
プログラムコード
# Albumentations物体検出データ拡張プログラム
#   物体検出用画像データの包括的拡張処理
#   論文: "Albumentations: Fast and Flexible Image Augmentations" (Information 2020)
#   GitHub: https://github.com/albumentations-team/albumentations
#   特徴: Albumentationsは高速で柔軟な画像拡張ライブラリ、物体検出でのSOTA性能
#         バウンディングボックス座標の自動変換、豊富な変換手法、高い実行速度
#   前準備: pip install albumentations opencv-python matplotlib numpy japanize-matplotlib

# 利用可能な学習済みモデル:
#   - YOLOv8, YOLOv9, YOLOv10, YOLOv11, YOLOv12: 最新YOLO系列(リアルタイム処理)
#   - Faster R-CNN: 高精度、特に小物体検出に優秀
#   - SSD (Single Shot Detector): 高速処理に最適化
#   - DETR (Detection Transformer): Transformer基盤のエンドツーエンド検出
#   - RT-DETR: リアルタイム対応のDETR改良版
#   - YOLO-NAS: Deci社開発、YOLOv5/v7/v8を上回る性能
#   - RetinaNet: 小物体検出とクラス不均衡対応
#   - EfficientDet: 効率的なスケーリングと高性能

import cv2
import numpy as np
import matplotlib.pyplot as plt
import matplotlib.patches as patches
import albumentations as A
import japanize_matplotlib

# 定数定義
IMAGE_SIZE = (416, 416)  # YOLO系モデルでよく使用される入力サイズ
RANDOM_SEED = 42  # 再現可能な結果のための乱数シード
BBOX_COLORS = ['red', 'blue', 'green', 'yellow', 'purple', 'orange']
AUGMENTATION_COUNT = 5  # 生成する拡張画像数
BATCH_SAMPLE_COUNT = 3  # バッチ処理のサンプル数

print("=== 物体検出用データ拡張デモ ===")
print("\n【概要】")
print("Albumentationsを使用した物体検出用データの拡張処理を実演します。")
print("バウンディングボックスを保持したまま、様々な画像変換を適用します。")
print("\n【操作方法】")
print("1. プログラムを実行すると自動的に処理が開始されます")
print("2. 最後に可視化結果がmatplotlibウィンドウで表示されます")
print("3. ウィンドウを閉じるとプログラムが終了します")
print("\n【注意事項】")
print("- サンプル画像は自動生成されます(実際の使用時は実画像を読み込んでください)")
print("- バウンディングボックスは自動的に変換後の座標に調整されます")
print("- min_visibility=0.3により、30%以上見える物体のみ保持されます")
print("\n" + "="*50 + "\n")

# 乱数シード設定
np.random.seed(RANDOM_SEED)

# メイン処理
print("1. サンプルデータ生成")

# サンプル画像生成
sample_image = np.random.randint(0, 255, (416, 416, 3), dtype=np.uint8)

# 物体を模擬した矩形描画
cv2.rectangle(sample_image, (50, 50), (150, 120), (255, 0, 0), -1)
cv2.rectangle(sample_image, (200, 180), (320, 280), (0, 255, 0), -1)
cv2.rectangle(sample_image, (100, 300), (200, 380), (0, 0, 255), -1)

sample_bounding_boxes = [[50, 50, 150, 120], [200, 180, 320, 280], [100, 300, 200, 380]]
sample_class_labels = [0, 1, 2]

print(f"画像サイズ: {sample_image.shape}")
print(f"バウンディングボックス数: {len(sample_bounding_boxes)}個")
print(f"クラス数: {len(set(sample_class_labels))}種類")

print("\n2. 単一画像の拡張")

# 訓練用変換設定
training_transform = A.Compose([
    A.LongestMaxSize(max_size=max(IMAGE_SIZE), p=1.0),
    A.PadIfNeeded(min_height=IMAGE_SIZE[0], min_width=IMAGE_SIZE[1],
                 border_mode=cv2.BORDER_CONSTANT, value=0, p=1.0),
    A.OneOf([
        A.ShiftScaleRotate(shift_limit=0.1, scale_limit=0.2, rotate_limit=15,
                         border_mode=cv2.BORDER_CONSTANT, value=0, p=1.0),
        A.Perspective(scale=(0.05, 0.15), p=1.0),
        A.Affine(translate_percent=(-0.1, 0.1), scale=(0.8, 1.2),
                shear=(-10, 10), p=1.0),
    ], p=0.7),
    A.HorizontalFlip(p=0.5),
    A.OneOf([
        A.ColorJitter(brightness=0.2, contrast=0.2, saturation=0.2,
                     hue=0.1, p=1.0),
        A.HueSaturationValue(hue_shift_limit=20, sat_shift_limit=30,
                           val_shift_limit=20, p=1.0),
        A.RandomBrightnessContrast(brightness_limit=0.2, contrast_limit=0.2,
                                 p=1.0),
    ], p=0.6),
    A.OneOf([
        A.GaussNoise(var_limit=(10, 50), p=1.0),
        A.MotionBlur(blur_limit=3, p=1.0),
    ], p=0.3),
    A.CoarseDropout(max_holes=8, max_height=32, max_width=32,
                   min_holes=1, fill_value=0, p=0.2),
], bbox_params=A.BboxParams(format='pascal_voc', label_fields=['labels'],
                           min_visibility=0.3))

# 元データ保存
original_image_data = {'image': sample_image, 'bboxes': sample_bounding_boxes,
                      'labels': sample_class_labels}

# データ拡張実行
augmented_image_list = []
for i in range(AUGMENTATION_COUNT):
    transformation_result = training_transform(image=sample_image,
                                             bboxes=sample_bounding_boxes,
                                             labels=sample_class_labels)
    augmented_image_list.append(transformation_result)
    print(f"拡張{i+1}: バウンディングボックス数 = {len(transformation_result['bboxes'])}個")

print("\n3. バッチ拡張")

# バッチデータ拡張
batch_processing_data = []
batch_processing_data.append({'image': sample_image, 'bboxes': sample_bounding_boxes,
                             'labels': sample_class_labels})
for i in range(BATCH_SAMPLE_COUNT - 1):
    batch_result = training_transform(image=sample_image,
                                    bboxes=sample_bounding_boxes,
                                    labels=sample_class_labels)
    batch_processing_data.append(batch_result)

print(f"バッチ拡張結果: {len(batch_processing_data)}件")

# 結果出力
print("\n4. 結果可視化")
print("グラフウィンドウが表示されます")

# 可視化処理
figure, subplot_axes = plt.subplots(2, 2, figsize=(16, 12))
subplot_axes = subplot_axes.flatten()

# 元画像表示
subplot_axes[0].imshow(original_image_data['image'])
subplot_axes[0].set_title("元画像")
subplot_axes[0].axis('off')

for bbox_coords, class_label in zip(original_image_data['bboxes'],
                                   original_image_data['labels']):
    x1, y1, x2, y2 = bbox_coords
    bbox_width, bbox_height = x2 - x1, y2 - y1

    rectangle_patch = patches.Rectangle((x1, y1), bbox_width, bbox_height,
                                       linewidth=2,
                                       edgecolor=BBOX_COLORS[int(class_label) % len(BBOX_COLORS)],
                                       facecolor='none')
    subplot_axes[0].add_patch(rectangle_patch)
    subplot_axes[0].text(x1, y1 - 5, f'クラス {int(class_label)}',
                        color=BBOX_COLORS[int(class_label) % len(BBOX_COLORS)],
                        fontsize=8, weight='bold')

# 拡張画像表示
for subplot_index in range(1, min(4, len(augmented_image_list) + 1)):
    data_index = min(subplot_index-1, len(augmented_image_list)-1)
    current_augmented_data = augmented_image_list[data_index]

    subplot_axes[subplot_index].imshow(current_augmented_data['image'])
    subplot_axes[subplot_index].set_title(f"拡張画像 {subplot_index}")
    subplot_axes[subplot_index].axis('off')

    for bbox_coords, class_label in zip(current_augmented_data['bboxes'],
                                       current_augmented_data['labels']):
        x1, y1, x2, y2 = bbox_coords
        bbox_width, bbox_height = x2 - x1, y2 - y1

        rectangle_patch = patches.Rectangle((x1, y1), bbox_width, bbox_height,
                                           linewidth=2,
                                           edgecolor=BBOX_COLORS[int(class_label) % len(BBOX_COLORS)],
                                           facecolor='none')
        subplot_axes[subplot_index].add_patch(rectangle_patch)
        subplot_axes[subplot_index].text(x1, y1 - 5, f'クラス {int(class_label)}',
                                        color=BBOX_COLORS[int(class_label) % len(BBOX_COLORS)],
                                        fontsize=8, weight='bold')

plt.tight_layout()
plt.show()

print("\n=== デモ完了 ===")
print("結果の読み方:")
print("- 元画像: 変換前のサンプル画像(3つの矩形物体)")
print("- 拡張画像: 各種変換を適用した結果(位置、色、形状の変化)")
print("- バウンディングボックス: 物体位置を示す枠(色別にクラス識別)")
使用方法
実行手順
- 上記のプログラムを実行する
実行結果と確認方法
コンソールに処理進行状況が表示される。2×2のグラフウィンドウが表示される。元画像(左上)と3つの拡張画像が表示される。各物体にバウンディングボックスとクラス番号が表示される。
元画像では3つの矩形物体(青、緑、赤)が表示される。拡張画像では回転、スケール、色調変更、ノイズ追加等の組み合わせが適用される。バウンディングボックスは物体の位置変化に合わせて調整される。元画像と比較して物体の位置や色が変化しているか、バウンディングボックスが適切に追従しているかを確認する。
実験・探求のアイデア
変換パラメータの調整実験
rotate_limitを5から30に変更して回転角度の影響を観察する(値を大きくするとバウンディングボックスが画像外に出る可能性がある)。scale_limitを0.1から0.5に変更してスケール変化の効果を確認する(値が極端な場合は物体が小さくなりすぎる)。brightness_limitを0.1から0.4に変更して明度変化の影響を検証する。
変換手法の組み合わせ実験
OneOfの確率値(p)を変更して適用頻度を調整する。A.CutoutやA.GridDistortionを追加して変換効果を確認する。A.RandomCropを追加して画像切り取り効果を観察する。
バウンディングボックス保持実験
min_visibilityを0.1から0.8に変更して物体の可視性閾値を調整する(値が高い場合は変換後に物体が除外されやすくなる)。スケール変更の範囲を0.3-2.0に設定してバウンディングボックス消失を観察する。回転角度を45度に設定してバウンディングボックスの変化を確認する。
データセット形式の活用
実際のデータセット形式での実験も可能である。COCO形式やPascal VOC形式(物体検出データセットの標準的なアノテーション形式)を使用することで、実用的な検証ができる。