DEM を扱う Shiny プログラム
動作画面例
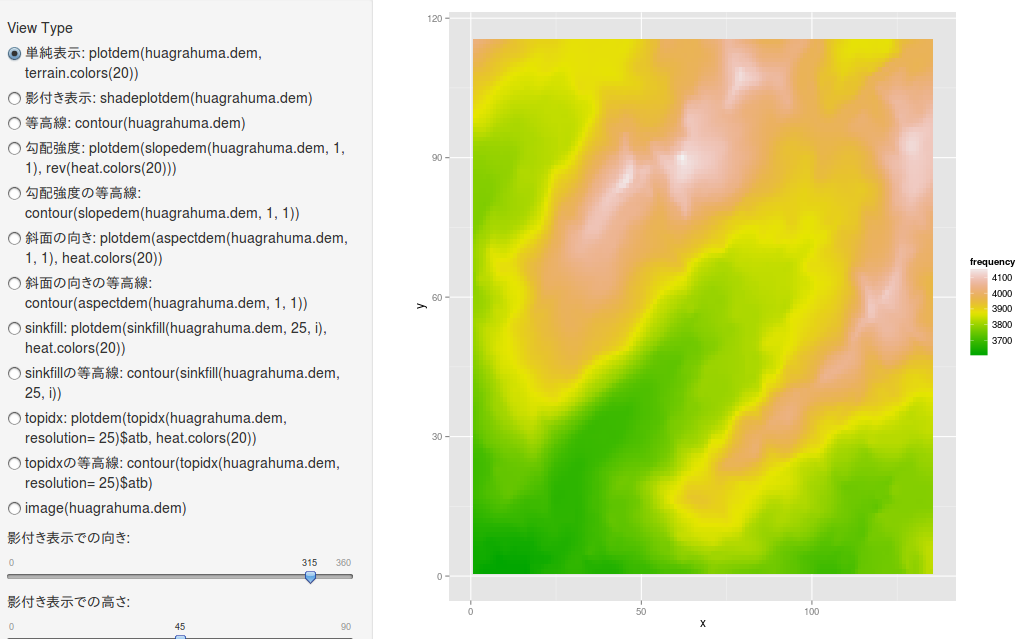
単純表示
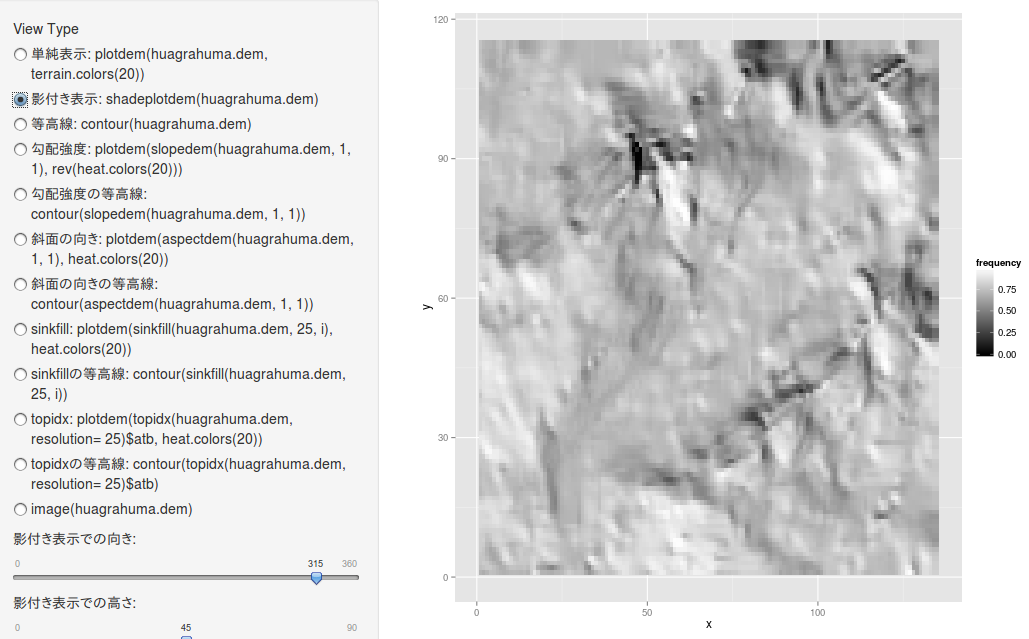
影付き表示
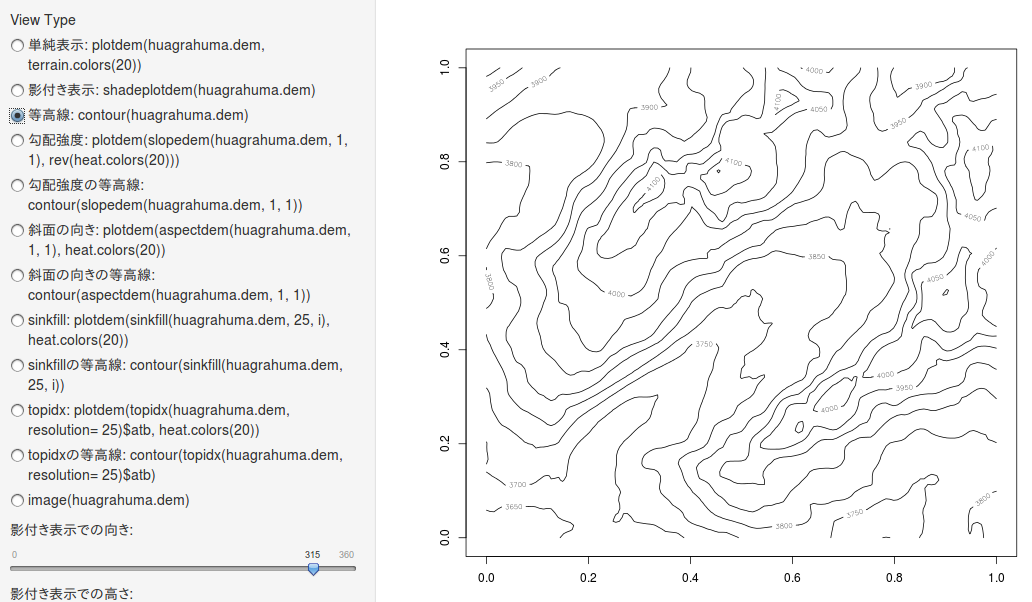
等高線
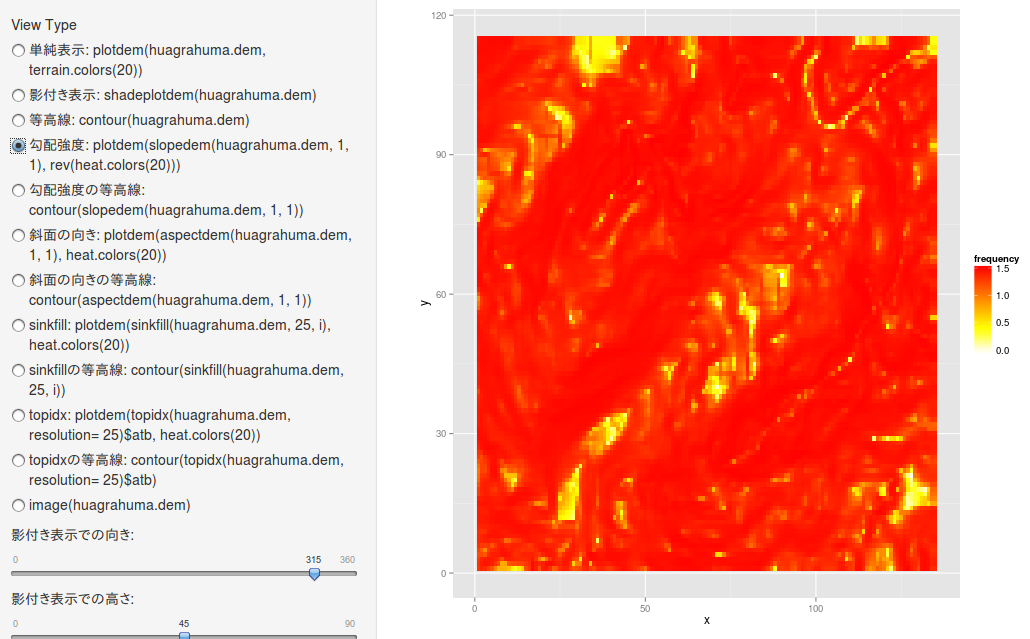
勾配強度
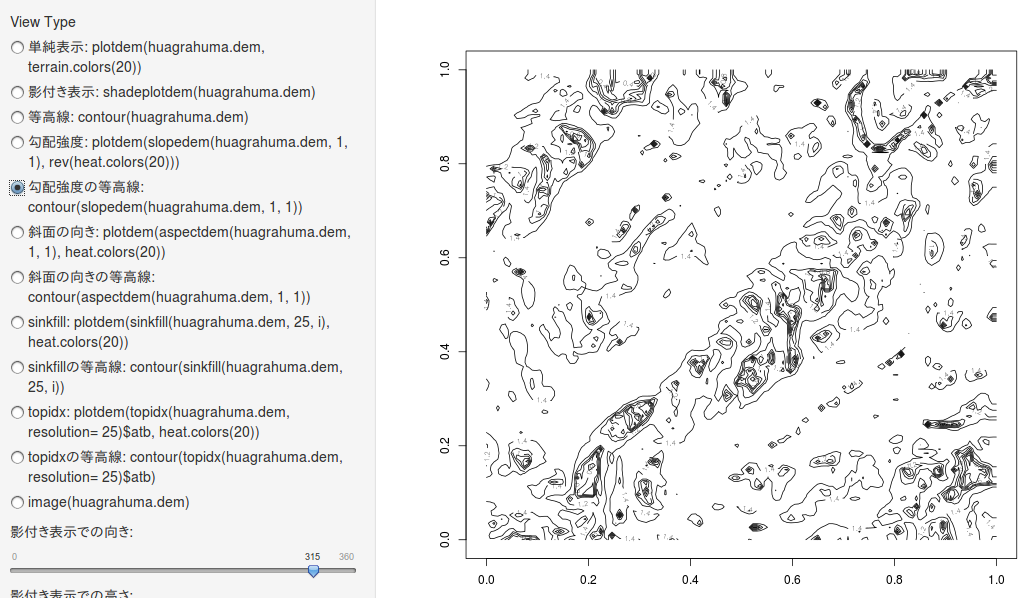
勾配強度の等高線
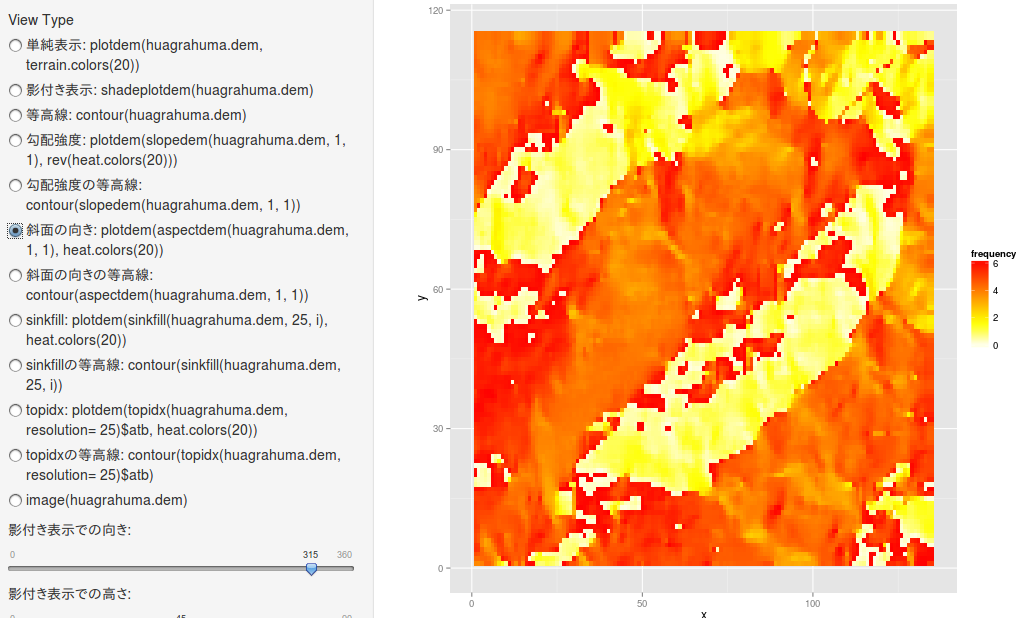
斜面の向き
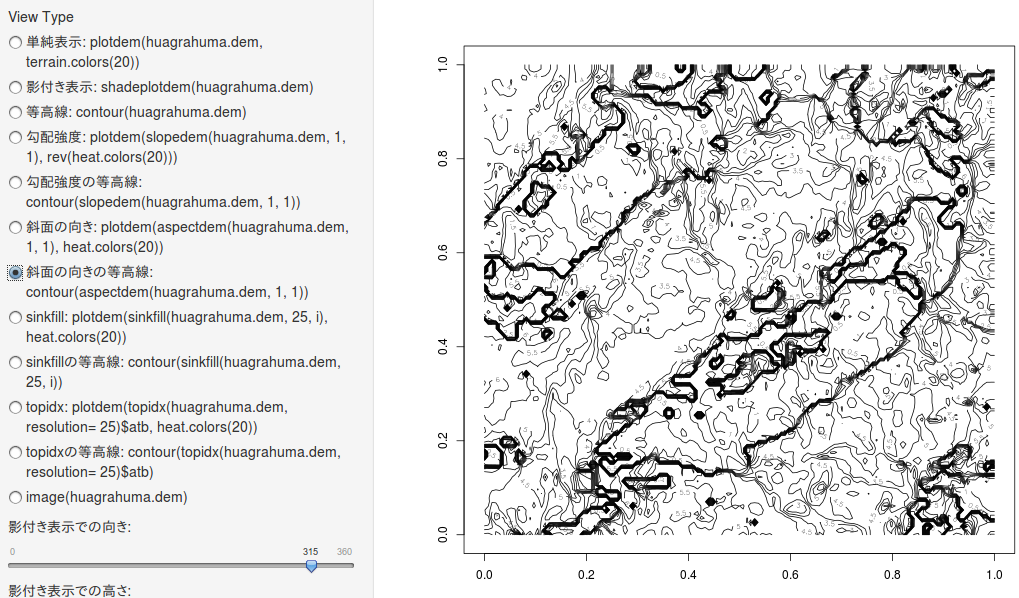
斜面の向きの等高線
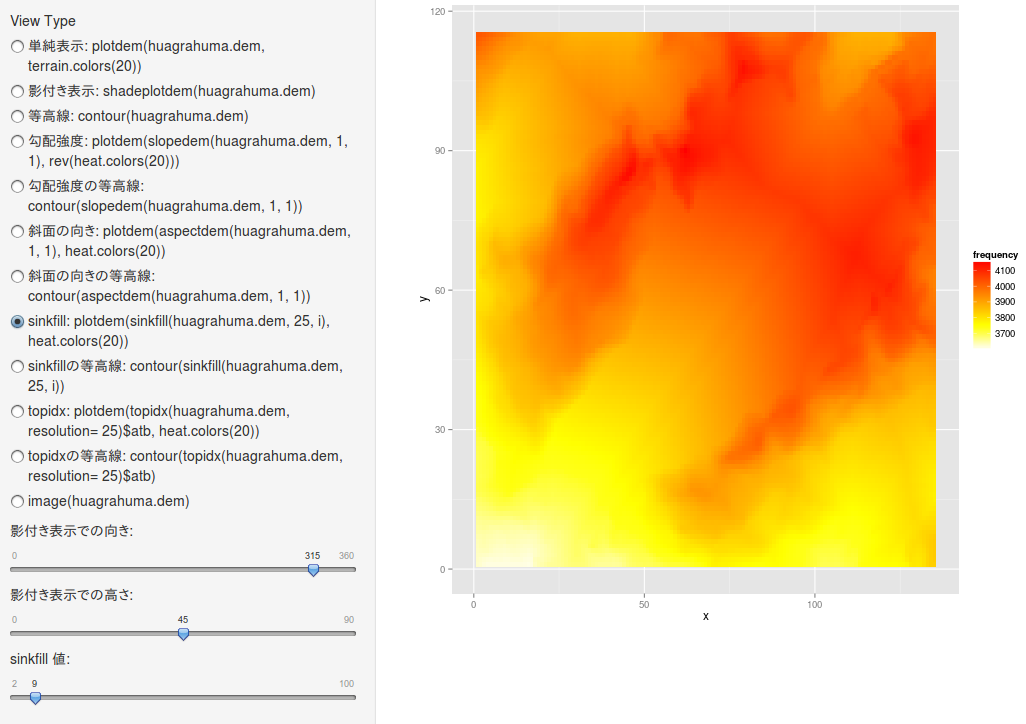
sinkfill
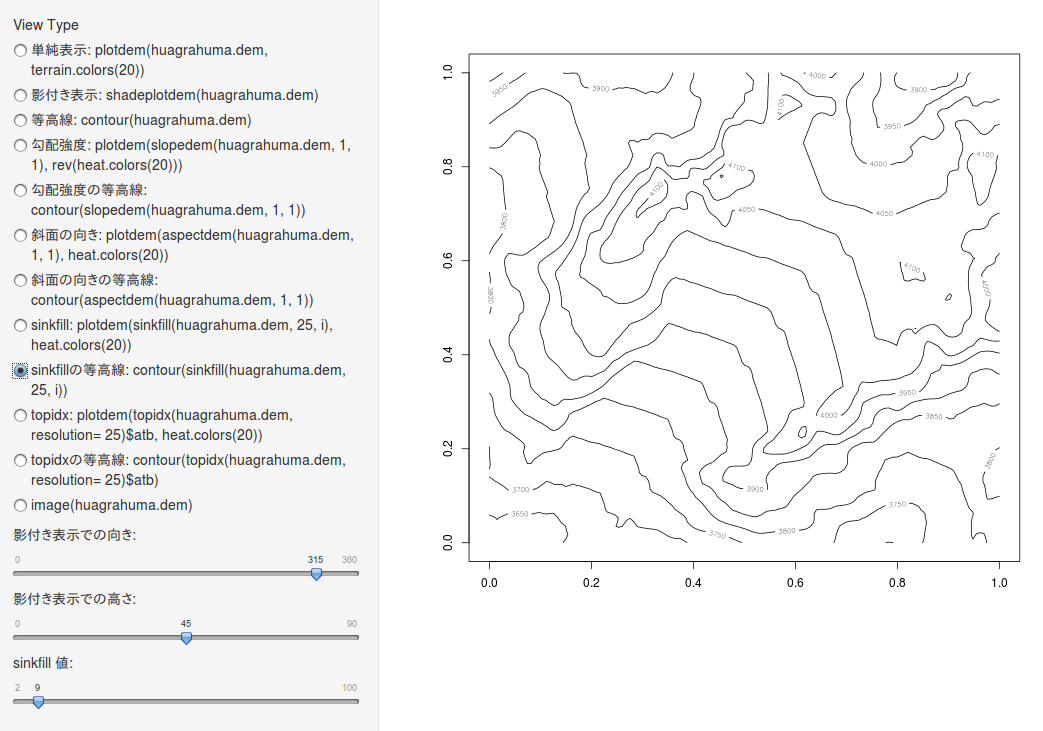
sinkfill の等高線
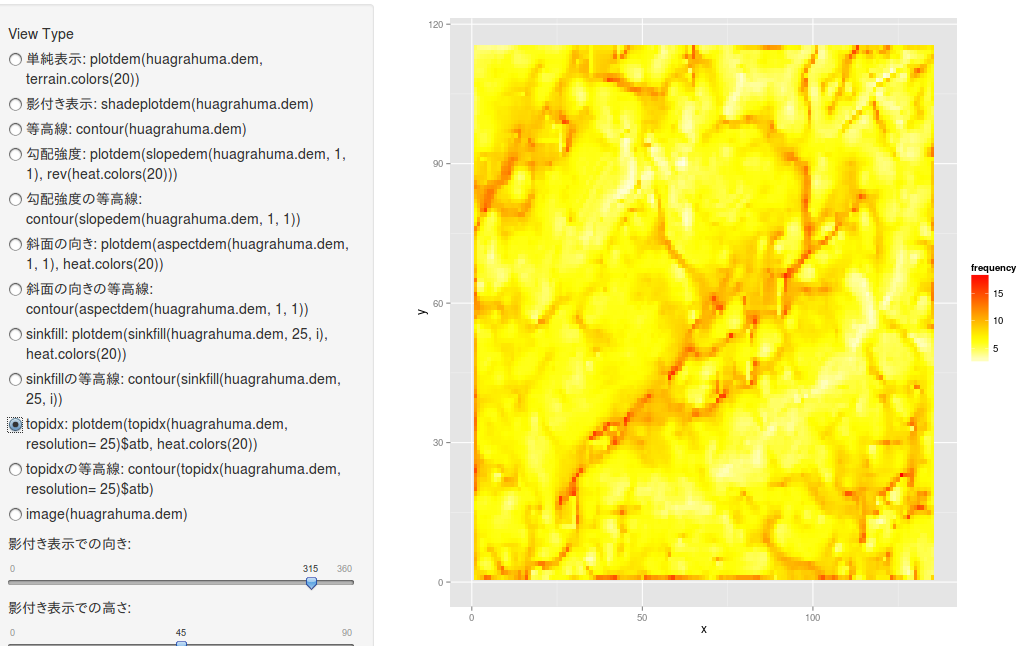
topidx
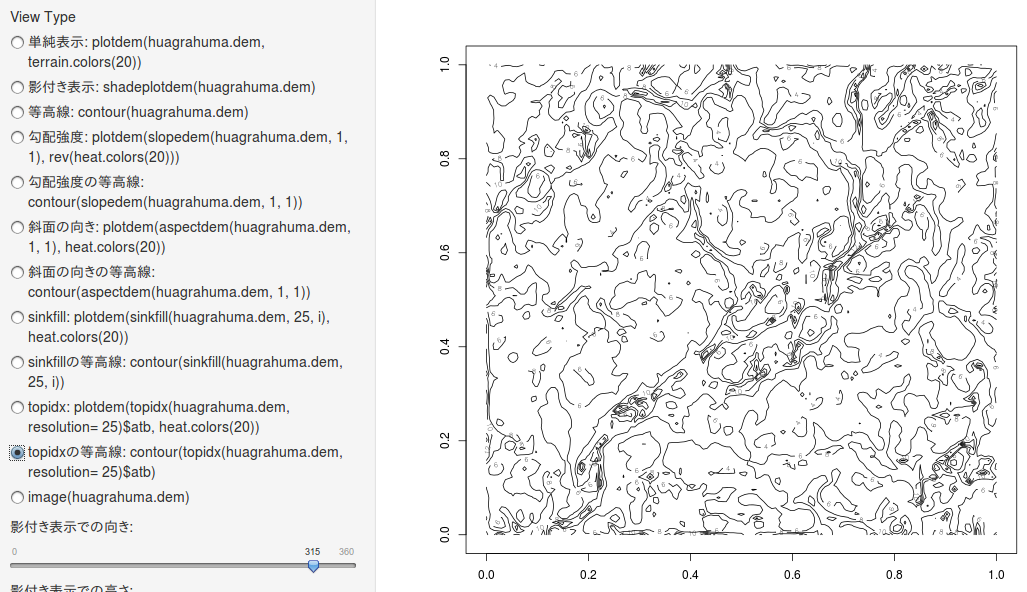
topidxの等高線
ソースコード
ui.r
require(shiny)

# Define UI for application that plots random distributions
shinyUI(pageWithSidebar(

  # Application title
  headerPanel("Hello!"),

  # Sidebar with a slider input for number of observations
  sidebarPanel(
    radioButtons('vt', 'View Type',
                 c('単純表示: plotdem(huagrahuma.dem, terrain.colors(20))'='plot',
                   '影付き表示: shadeplotdem(huagrahuma.dem)'='shadeplot',
                   '等高線: contour(huagrahuma.dem)'='contour',
                   '勾配強度: plotdem(slopedem(huagrahuma.dem, 1, 1), rev(heat.colors(20)))'='slopedem',
                   '勾配強度の等高線: contour(slopedem(huagrahuma.dem, 1, 1))'='slopedem_contour',
                   '斜面の向き: plotdem(aspectdem(huagrahuma.dem, 1, 1), heat.colors(20)) '='aspectdem',
                   '斜面の向きの等高線: contour(aspectdem(huagrahuma.dem, 1, 1)) '='aspectdem_contour',
                   'sinkfill: plotdem(sinkfill(huagrahuma.dem, 25, i), heat.colors(20))'='sinkfill',
                   'sinkfillの等高線: contour(sinkfill(huagrahuma.dem, 25, i))'='sinkfill_contour',
                   'topidx: plotdem(topidx(huagrahuma.dem, resolution= 25)$atb, heat.colors(20)) '='topidx',
                   'topidxの等高線: contour(topidx(huagrahuma.dem, resolution= 25)$atb) '='topidx_contour',
                   'image(huagrahuma.dem)'='image'),
		   '単純表示: plotdem(huagrahuma.dem, terrain.colors(20))'),

    sliderInput("dir",
                "影付き表示での向き:",
                min = 0,
                max = 360,
                value = 315),

    sliderInput("a",
                "影付き表示での高さ:",
                min = 0,
                max = 90,
                value = 45),

    sliderInput("i",
                "sinkfill 値:",
                min = 2,
                max = 100,
                value = 5)

  ),

  # Show a plot of the generated distribution
  mainPanel(
    plotOutput("distPlot", width="100%", height="100%")
  )
))
server.r
require(shiny)

require(ggplot2)
require(topmodel)
require(insol)
require(data.table)

data(huagrahuma)
data(huagrahuma.dem)

plotdem <- function(DEM, c) {
  x <- rep(1:nrow(DEM), ncol(DEM))      # 1 2 3 1 2 3 1 2 3 1 2 3
  y <- rep(1:ncol(DEM), each=nrow(DEM)) # 1 1 1 1 2 2 2 2 3 3 3 3

  T <- data.table(x=x, y=y, val=as.numeric(DEM))
  p <- ggplot(T, aes(x=x, y=y, fill=val)) + geom_tile() + scale_fill_gradientn("frequency", colours = c)
  return(p)
}

slopedem <- function(DEM, dl_long, dl_lat) {
  return( slope( cgrad(DEM, dl_long, dl_lat) ) )
}

aspectdem <- function(DEM, dl_long, dl_lat) {
  return( aspect( cgrad(DEM, dl_long, dl_lat) ) )
}

shadeplotdem <- function(DEM, dir, a) {
  cellsize=30
  sv=normalvector(a, dir)
  grd=cgrad(DEM, cellsize)
  hsh=grd[,,1]*sv[1]+grd[,,2]*sv[2]+grd[,,3]*sv[3]
  ## remove negative incidence angles (self shading)
  hsh=(hsh+abs(hsh))/2
  sh=doshade(DEM, sv, cellsize)
  p <- plotdem(hsh*sh, grey(1:100/100))
  return(p)
}

shinyServer(function(input, output) {

  output$distPlot <- renderPlot({
  print(input$vt)

  if (input$vt == 'plot') {
    p <- plotdem(huagrahuma.dem, terrain.colors(20))
    print(p)
  }
  else if (input$vt == 'shadeplot') {
    p <- shadeplotdem(huagrahuma.dem, input$dir, input$a)
    print(p)
  }
  else if (input$vt == 'contour') {
     contour(huagrahuma.dem)
  }
  else if (input$vt == 'slopedem') {
     p <- plotdem(slopedem(huagrahuma.dem, 1, 1), rev(heat.colors(20)))
    print(p)
  }
  else if (input$vt == 'slopedem_contour') {
     contour(slopedem(huagrahuma.dem, 1, 1))
  }
  else if (input$vt == 'aspectdem') {
     p <- plotdem(aspectdem(huagrahuma.dem, 1, 1), rev(heat.colors(20)))
    print(p)
  }
  else if (input$vt == 'aspectdem_contour') {
     contour(aspectdem(huagrahuma.dem, 1, 1))
  }
  else if (input$vt == 'sinkfill') {
     p <- plotdem(sinkfill(huagrahuma.dem, 25, input$i), rev(heat.colors(20)))
    print(p)
  }
  else if (input$vt == 'sinkfill_contour') {
     contour(sinkfill(huagrahuma.dem, 25, input$i))
  }
  else if (input$vt == 'topidx') {
     p <- plotdem( topidx(huagrahuma.dem, resolution= 25)$atb, rev(heat.colors(20)))
    print(p)
  }
  else if (input$vt == 'topidx_contour') {
     contour( topidx(huagrahuma.dem, resolution= 25)$atb )
  }
  else if (input$vt == 'image') {
     image(huagrahuma.dem)
  }
    # dist <- rnorm(n = input$n, mean = input$mean, sd = input$sd)
    # hist(dist)
  }, height=640, width=640)
})
run.r
require(shiny)
runApp("/var/tmp")