Octave での MatlabFns
Octave での MatlabFns の例を示す.
◆ このWeb ページで行うこと
- Canny エッジ (Canny Edge)
- Harris コーナ検出器 (Harris Corner detector)
- Loy and Zelinski の高速 radial 特徴検出器
- 5-tap 係数を用いた1階微分と2階微分
- 7-tap 係数を用いた1階微分と2階微分
- Phase Congruency を用いた特徴検出 (Feature Detection)
- Thresholding と二値化
- to be filled
-
 , phasecongmono.m
-
 , phasecong3.m
-
 , phasesymmono.m
-
前準備
- Octave のインストールが済んでいること.
- MatlabFns を入手し、分かりやすいディレクトリ(例えば /usr/local/MatlabFns)に展開
- MatlabFns を使うように .octaverc を設定する
◆ 設定例
setenv("CFLAGS", "-D__STDC_CONSTANT_MACROS");
setenv("CXXFLAGS", "-D__STDC_CONSTANT_MACROS");
addpath ("/usr/local/MatlabFns/FingerPrints");
addpath ("/usr/local/MatlabFns/FrequencyFilt");
addpath ("/usr/local/MatlabFns/GreyTrans");
addpath ("/usr/local/MatlabFns/LineSegments");
addpath ("/usr/local/MatlabFns/Match");
addpath ("/usr/local/MatlabFns/Misc");
addpath ("/usr/local/MatlabFns/PhaseCongruency");
addpath ("/usr/local/MatlabFns/Projective");
addpath ("/usr/local/MatlabFns/Robust");
addpath ("/usr/local/MatlabFns/Rotations");
addpath ("/usr/local/MatlabFns/Shapelet");
addpath ("/usr/local/MatlabFns/Spatial");
addpath ("/usr/local/share/octave/mex");
必見 Web ページ: http://www.csse.uwa.edu.au/~pk/Research/MatlabFns/
必見 Web ページ: http://www.eecs.berkeley.edu/Research/Projects/CS/vision/bsds/
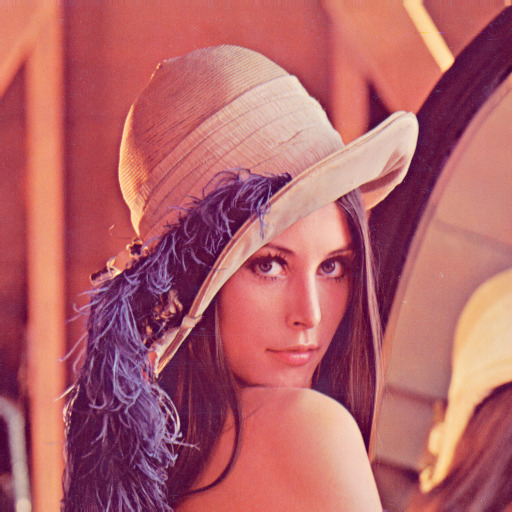
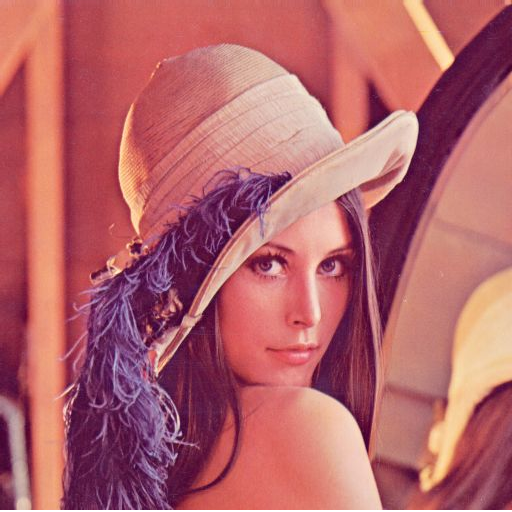
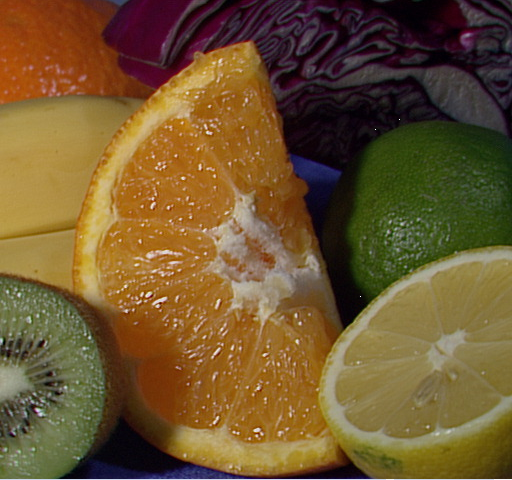
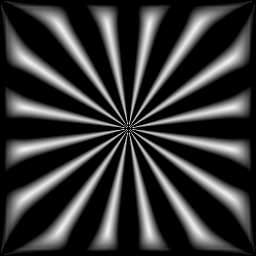
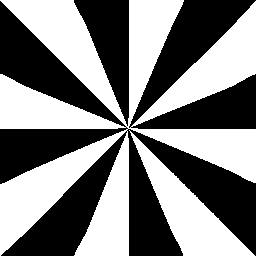
説明に使う濃淡画像
この Web ページの手順をそのままなぞる場合には, 下記の手順で画像ファイルのダウンロードと確認を行う.
- 画像ファイルのダウンロード
◆ 使用する画像ファイルのダウンロード手順例
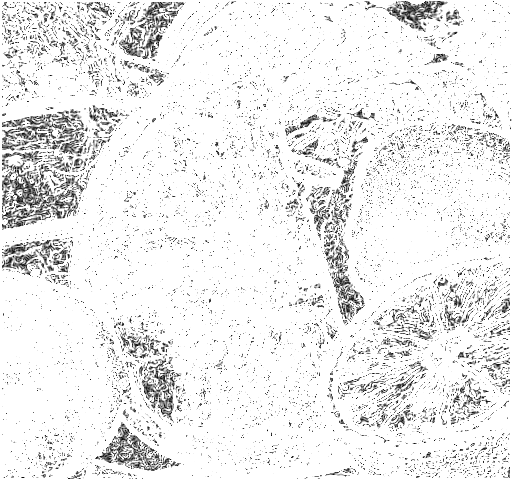
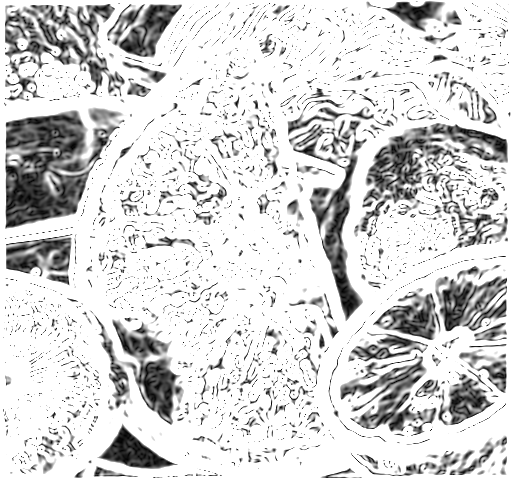
cd /tmp curl -O https://www.kkaneko.jp/sample/lena_std.jpg curl -L https://github.com/opencv/opencv/blob/master/samples/data/fruits.jpg?raw=true -o fruits.jpg - Octave の起動
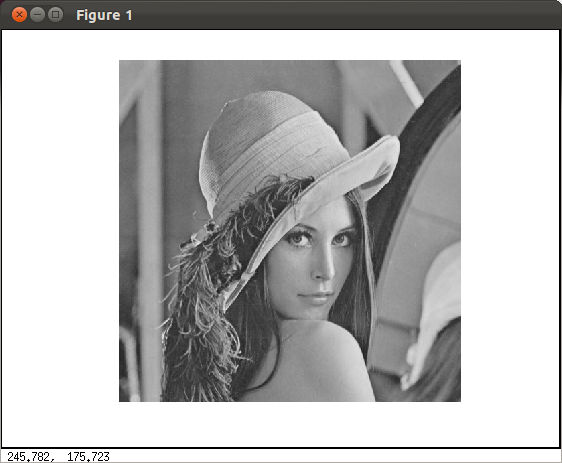
octave - 確認のため,表示してみる。
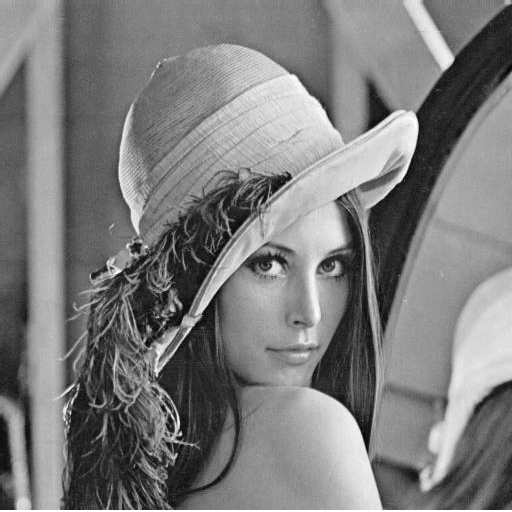
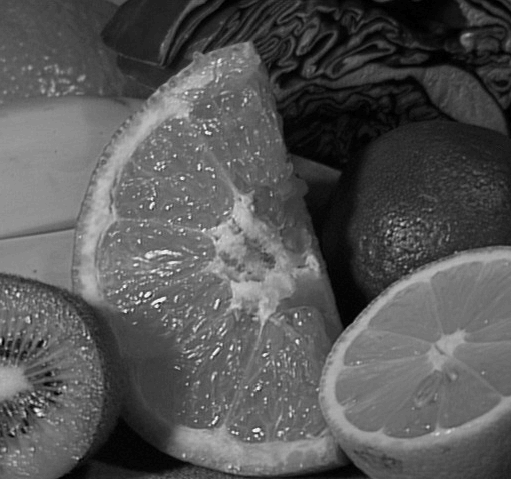
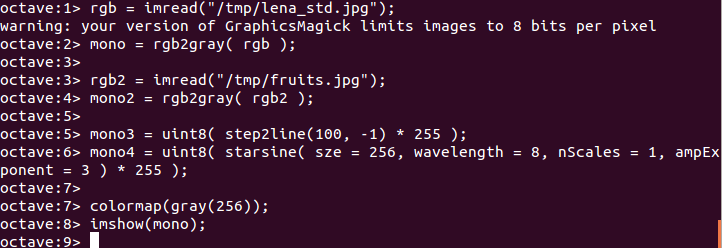
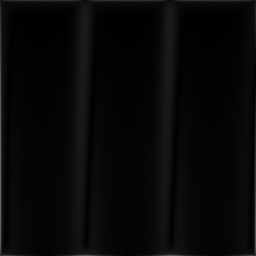
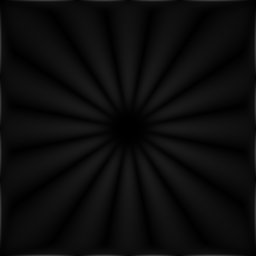
画像ファイルを変数 rgb と rgb2 に読み込み,RGB 画像を濃淡画像に変換
* Windows では「imread("r:/lena_std.jpg");」のようになる.
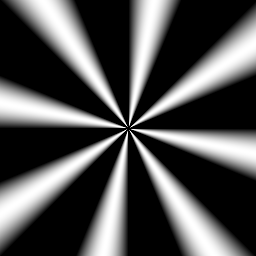
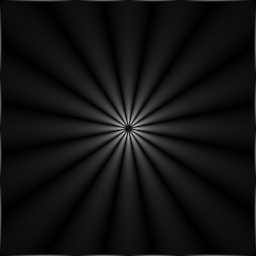
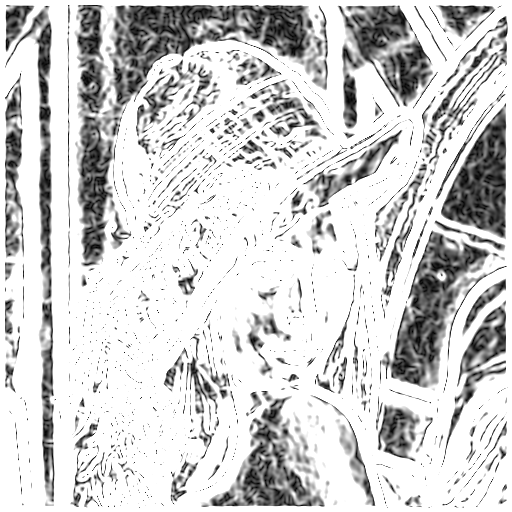
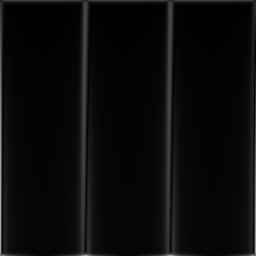
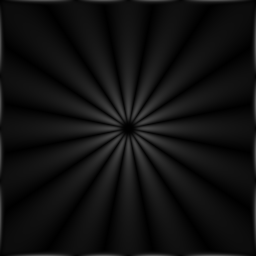
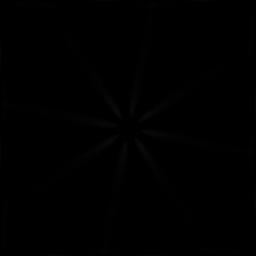
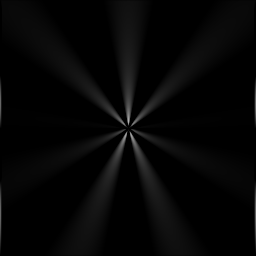
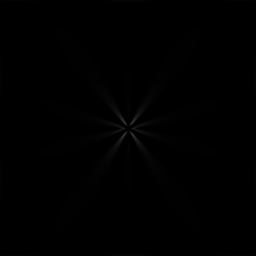
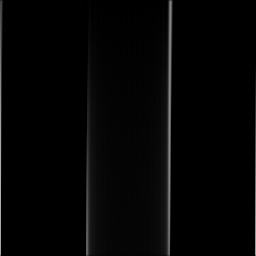
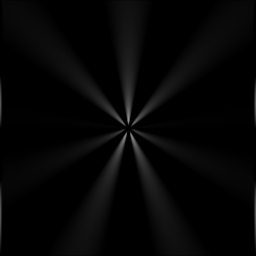
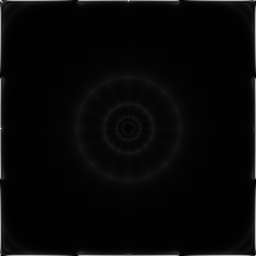
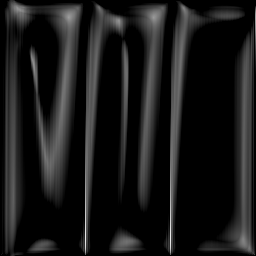
rgb = imread("/tmp/lena_std.jpg");
mono = rgb2gray( rgb );

rgb2 = imread("/tmp/fruits.jpg");
mono2 = rgb2gray( rgb2 );

mono3 = step2line(100,-1);
# mono4 = circsine( sze = 256, wavelength = 40 );
mono4 = starsine( sze = 256, wavelength = 8, nScales = 1, ampExponent = 3 );

colormap(gray(256));
imshow(mono);
imshow(mono2);
imshow(mono3, [0 1]);
imshow(mono4, [0 1]);
| 元画像 |
|
|
||
| 濃淡画像 |
|
|

|
|
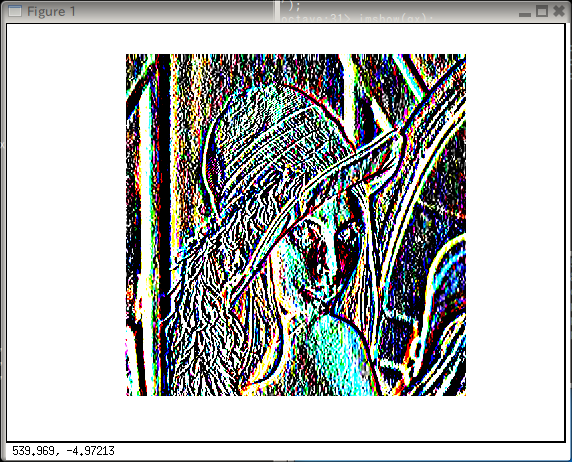
◆ Ubuntu 11.10 での実行結果例
空間周波数 (spatial frequency) の検出
Reference: see http://www.csse.uwa.edu.au/~pk/Research/MatlabFns/#spatial
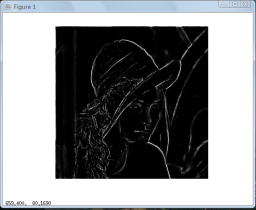
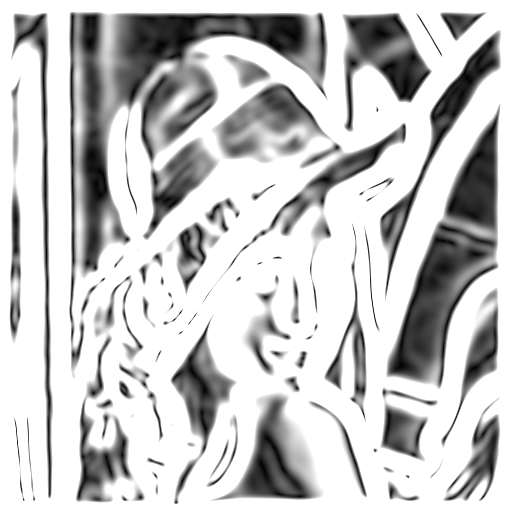
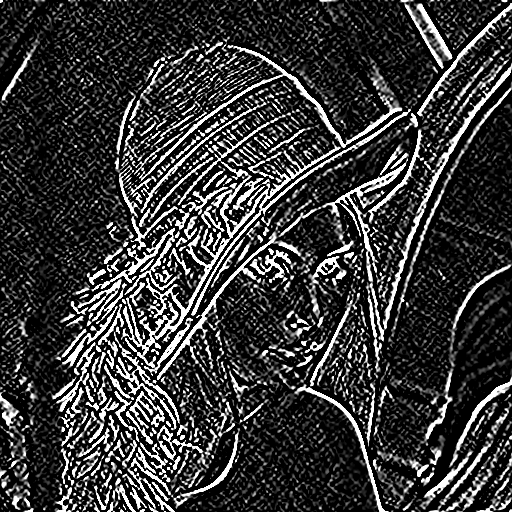
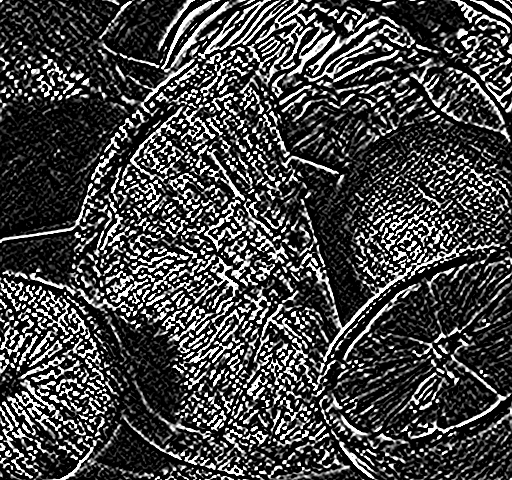
Canny エッジ (Canny Edge)
[gradient or] = canny(mono, 0.1);
imshow(gradient);
|
|
|
|
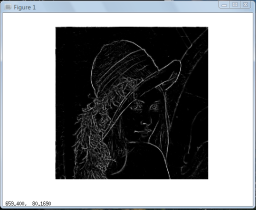
[gradient or] = canny(mono, 2);
imshow(gradient);
|
|
|
|
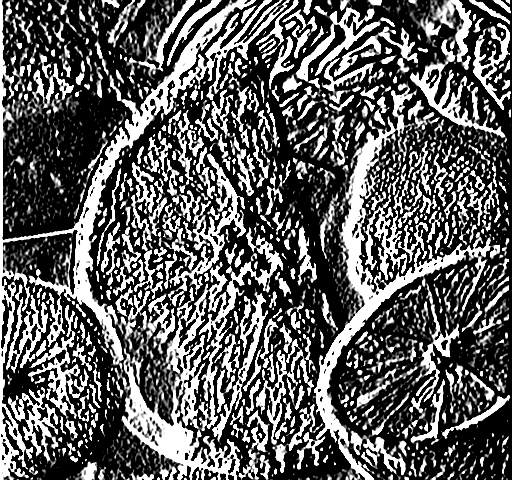
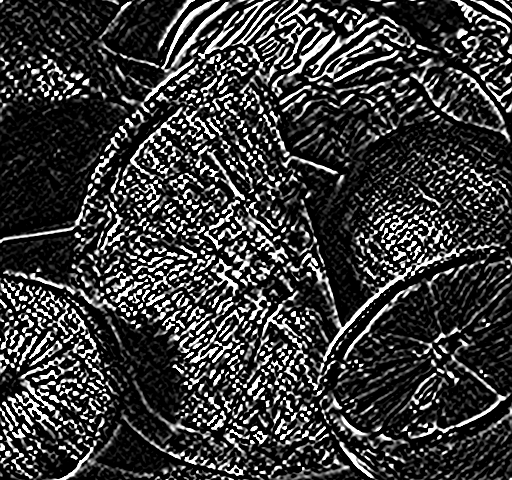
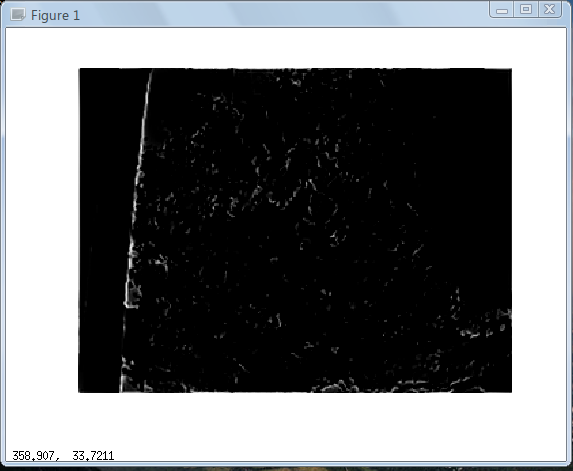
[gradient or] = canny(mono, 6);
imshow(gradient);
|
|
|
|
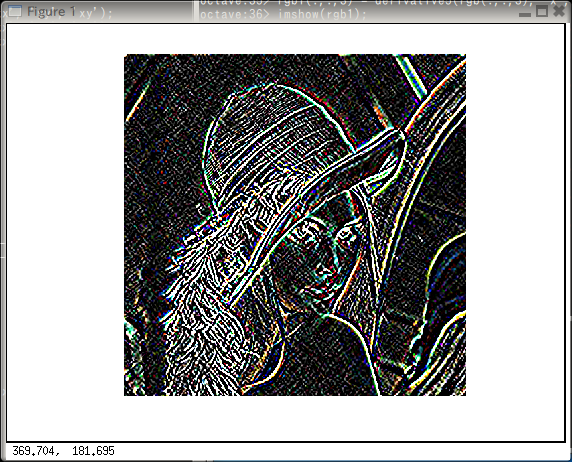
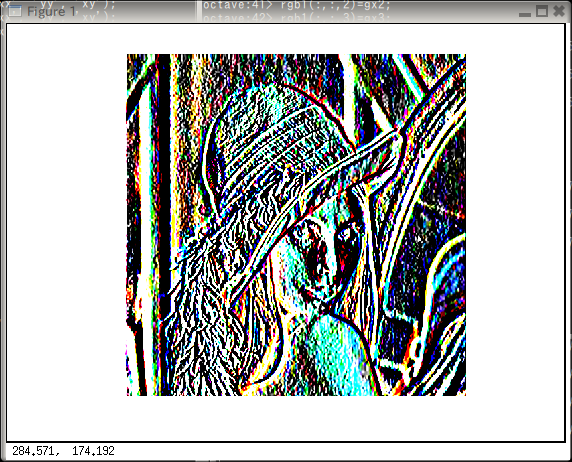
[rgb1(:,:,1) or1] = canny(rgb(:,:,1), 4);
[rgb1(:,:,2) or1] = canny(rgb(:,:,2), 4);
[rgb1(:,:,3) or1] = canny(rgb(:,:,3), 4);
imshow(rgb1);
Harris コーナ検出器 (Harris Corner detector)
[cim, r, c, rsubp, csubp] = harris(mono, 0.4);
imshow(cim);
|
|

|

|
[cim, r, c, rsubp, csubp] = harris(mono, 2);
imshow(cim);
|
|

|

|
[cim, r, c, rsubp, csubp] = harris(mono, 8);
imshow(cim);
|
|

|

|
[rgb1(:,:,1), r1, c1, rsubp1, csubp1] = harris(rgb(:,:,1), 1);
[rgb1(:,:,2), r2, c2, rsubp2, csubp2] = harris(rgb(:,:,2), 1);
[rgb1(:,:,3), r3, c3, rsubp3, csubp3] = harris(rgb(:,:,3), 1);
imshow(rgb1);
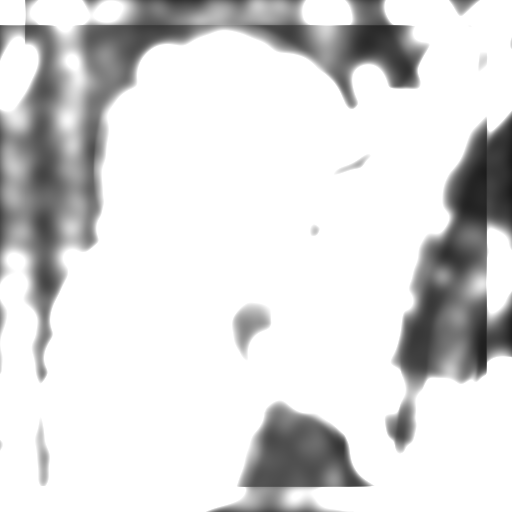
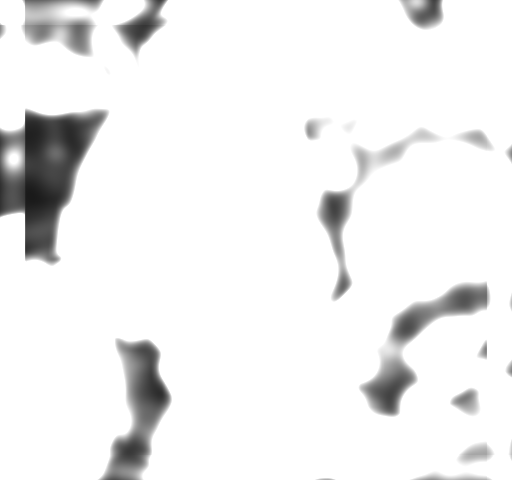
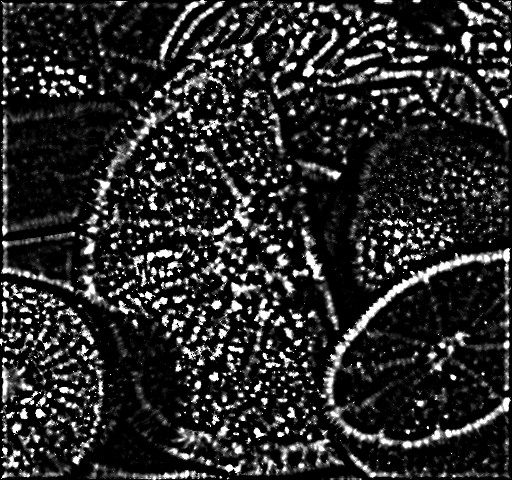
Loy and Zelinski の高速 radial 特徴検出器
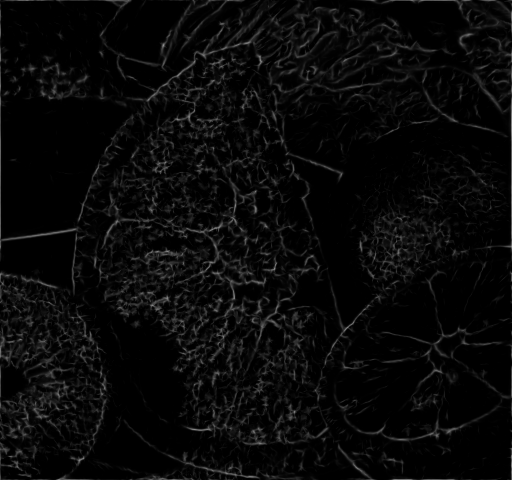
S = fastradial(mono, [1 3 5], 1, 0);
imshow(S)
|
|

|
|
rgb1(:,:,1) = fastradial(rgb(:,:,1), [1 3 5], 1, 0);
rgb1(:,:,2) = fastradial(rgb(:,:,2), [1 3 5], 1, 0);
rgb1(:,:,3) = fastradial(rgb(:,:,3), [1 3 5], 1, 0);
imshow(rgb1);
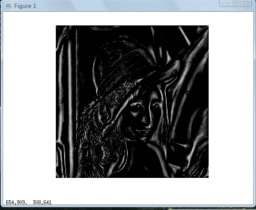
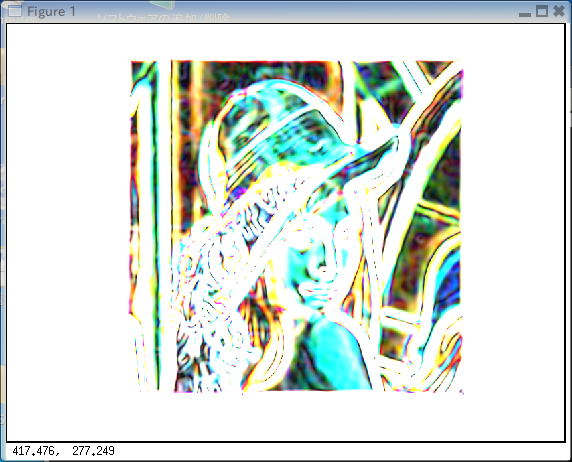
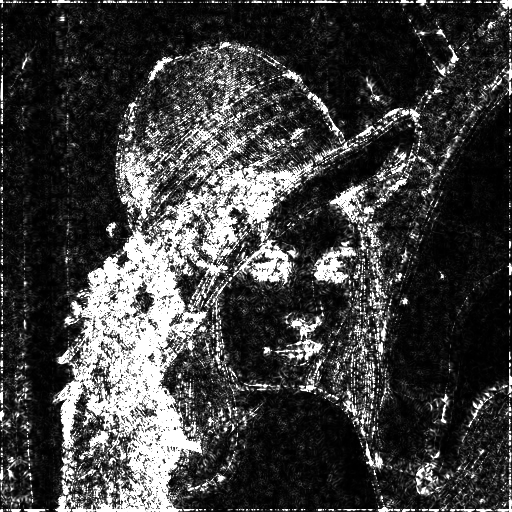
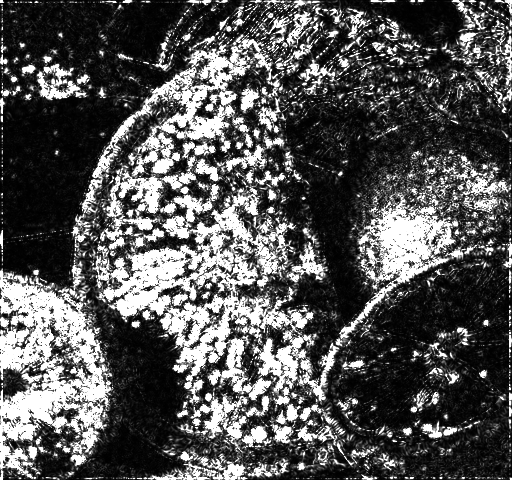
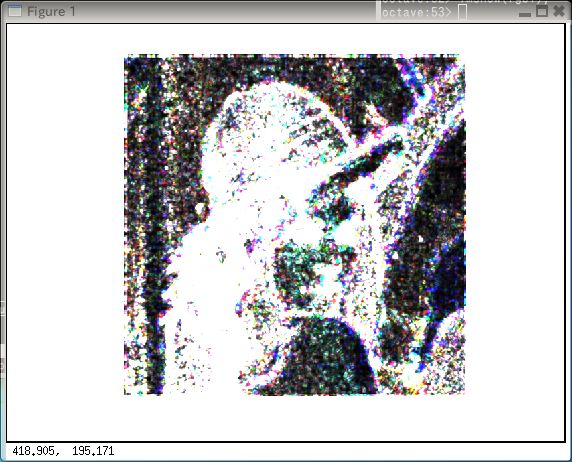
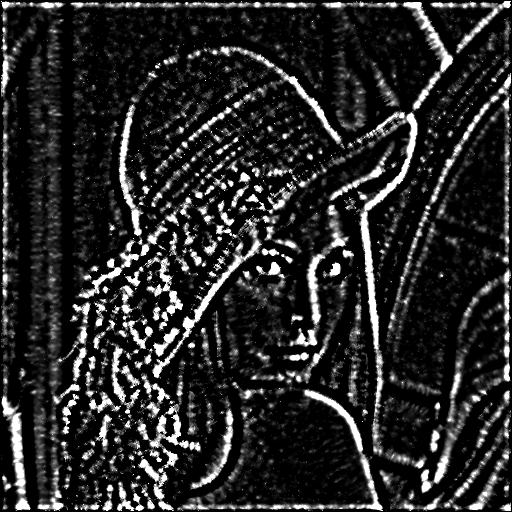
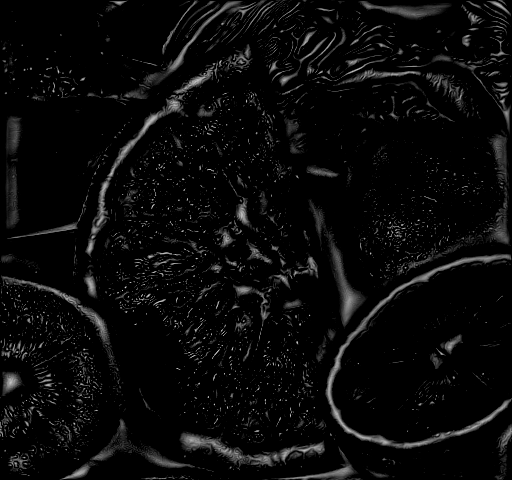
5-tap 係数を用いた1階微分と2階微分
1階微分
[gx, gy, gxx, gyy, gxy] = derivative5(mono, 'x', 'y', 'xx', 'yy', 'xy');
imshow(gx)
|

|

|
|
[gx1, gy1, gxx1, gyy1, gxy1] = derivative5(rgb(:,:,1), 'x', 'y', 'xx', 'yy', 'xy');
[gx2, gy2, gxx2, gyy2, gxy2] = derivative5(rgb(:,:,2), 'x', 'y', 'xx', 'yy', 'xy');
[gx3, gy3, gxx3, gyy3, gxy3] = derivative5(rgb(:,:,3), 'x', 'y', 'xx', 'yy', 'xy');
rgb1(:,:,1)=gx1;
rgb1(:,:,2)=gx2;
rgb1(:,:,3)=gx3;
imshow(rgb1);
2 階微分
[gx, gy, gxx, gyy, gxy] = derivative5(mono, 'x', 'y', 'xx', 'yy', 'xy');
imshow(gxy)
|
|

|
|
[gx1, gy1, gxx1, gyy1, gxy1] = derivative5(rgb(:,:,1), 'x', 'y', 'xx', 'yy', 'xy');
[gx2, gy2, gxx2, gyy2, gxy2] = derivative5(rgb(:,:,2), 'x', 'y', 'xx', 'yy', 'xy');
[gx3, gy3, gxx3, gyy3, gxy3] = derivative5(rgb(:,:,3), 'x', 'y', 'xx', 'yy', 'xy');
rgb1(:,:,1)=gxy1;
rgb1(:,:,2)=gxy2;
rgb1(:,:,3)=gxy3;
imshow(rgb1);
7-tap 係数を用いた1階微分と2階微分
1階微分
[gx, gy, gxx, gyy, gxy] = derivative7(mono, 'x', 'y', 'xx', 'yy', 'xy');
imshow(gx)

|
|
|
|
[gx1, gy1, gxx1, gyy1, gxy1] = derivative7(rgb(:,:,1), 'x', 'y', 'xx', 'yy', 'xy');
[gx2, gy2, gxx2, gyy2, gxy2] = derivative7(rgb(:,:,2), 'x', 'y', 'xx', 'yy', 'xy');
[gx3, gy3, gxx3, gyy3, gxy3] = derivative7(rgb(:,:,3), 'x', 'y', 'xx', 'yy', 'xy');
rgb1(:,:,1)=gx1;
rgb1(:,:,2)=gx2;
rgb1(:,:,3)=gx3;
imshow(rgb1);
2階微分
[gx, gy, gxx, gyy, gxy] = derivative7(mono, 'x', 'y', 'xx', 'yy', 'xy');
imshow(gxy)

|
|

|

|
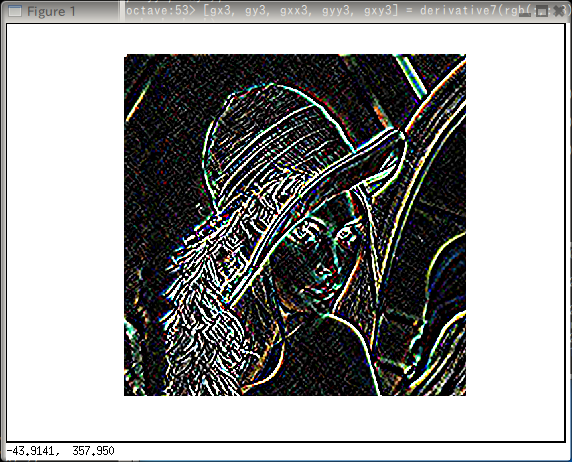
[gx1, gy1, gxx1, gyy1, gxy1] = derivative7(rgb(:,:,1), 'x', 'y', 'xx', 'yy', 'xy');
[gx2, gy2, gxx2, gyy2, gxy2] = derivative7(rgb(:,:,2), 'x', 'y', 'xx', 'yy', 'xy');
[gx3, gy3, gxx3, gyy3, gxy3] = derivative7(rgb(:,:,3), 'x', 'y', 'xx', 'yy', 'xy');
rgb1(:,:,1)=gxy1;
rgb1(:,:,2)=gxy2;
rgb1(:,:,3)=gxy3;
imshow(rgb1);
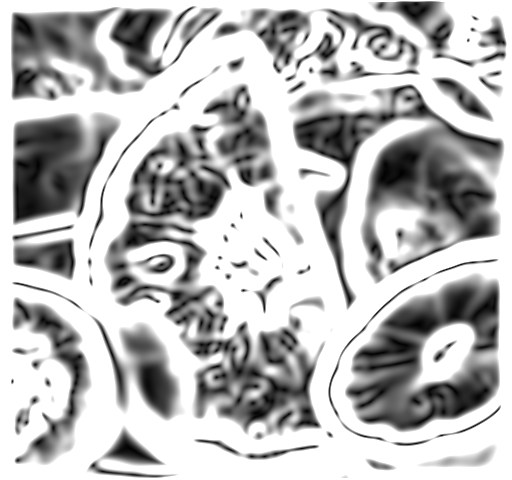
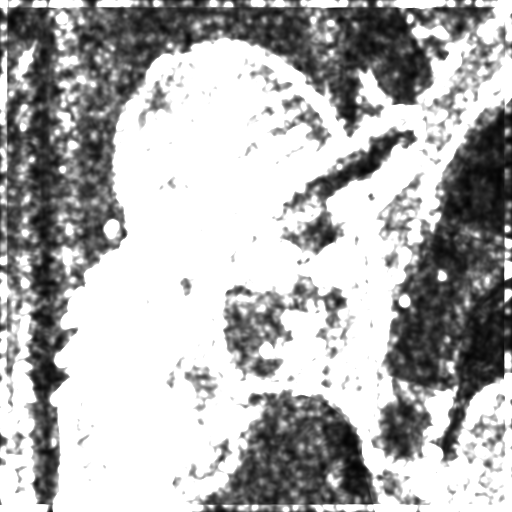
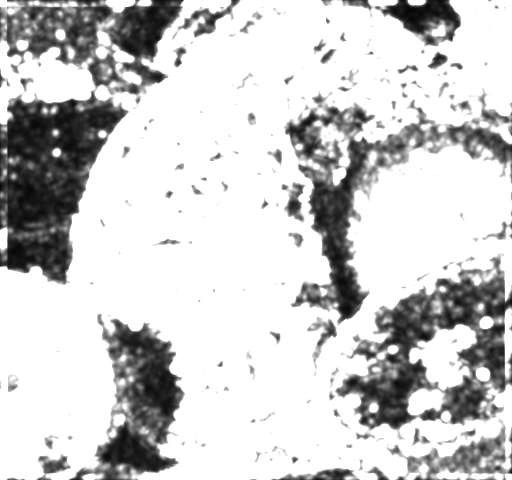
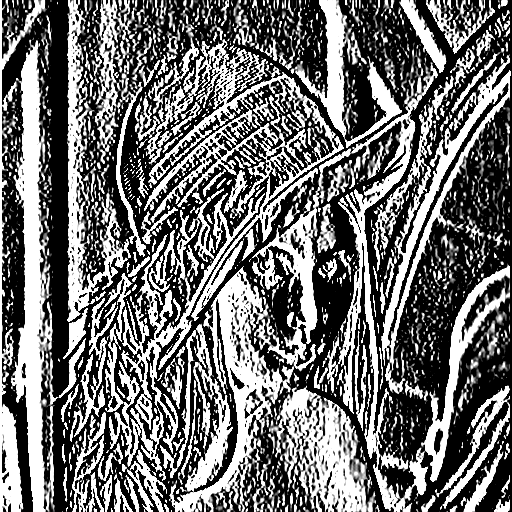
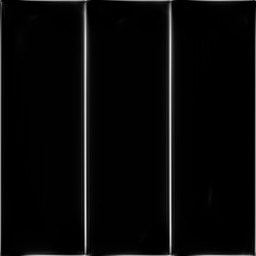
Phase Congruency を用いた特徴検出 (Feature Detection)
- phasecongmono.m
[PC or ft T] = phasecongmono(mono);
imshow(PC);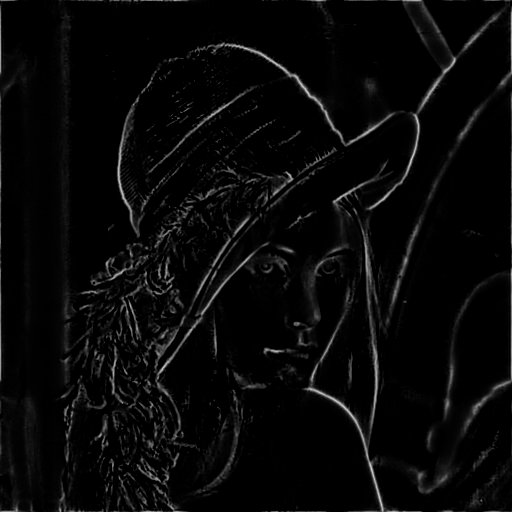
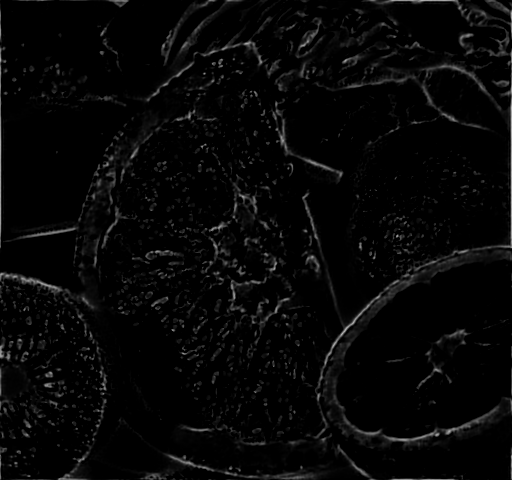
phasecongmono(rgb2gray(img))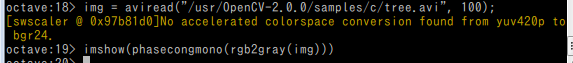
- phasecong3.m
[M m or ft pc EO T] = phasecong3(mono);
imshow(M);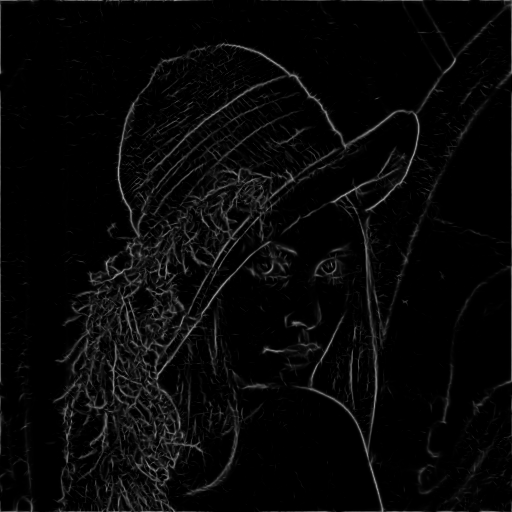
- phasesymmono.m
[phaseSym, symmetryEnergy, T] = phasesymmono(mono);
imshow(phaseSym);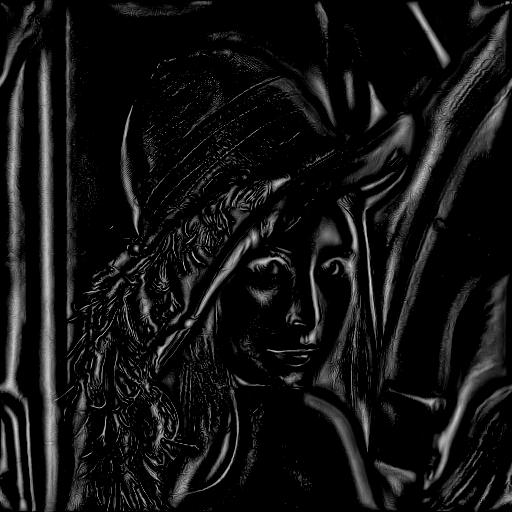
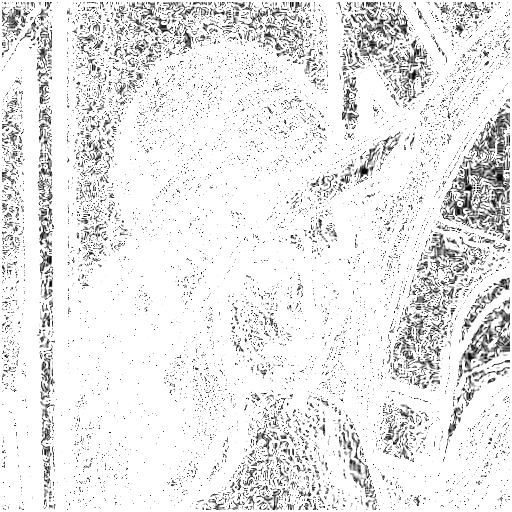
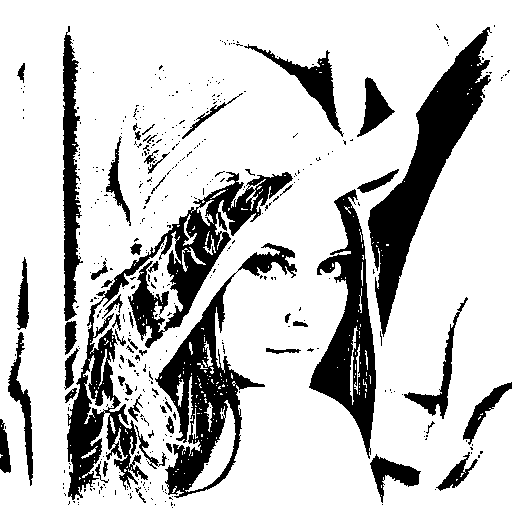
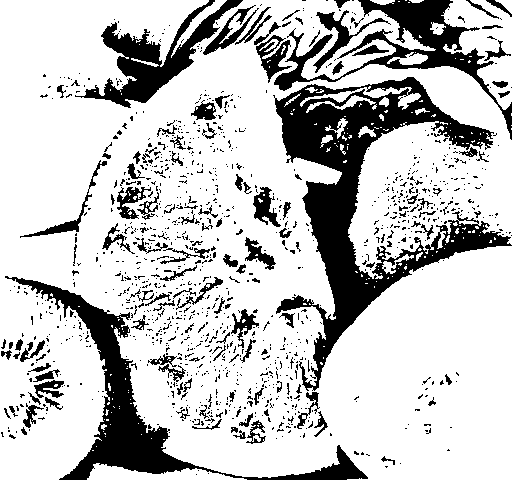
Thresholding
2値化
bw = adaptivethreah(mono);
imshow(bw);
|
|

|
|
試しに(R,G,Bの3次元で、独立して2値化するので8色できる)
rgb1(:,:,1)=adaptivethreah(rgb(:,:,1));
rgb1(:,:,2)=adaptivethreah(rgb(:,:,2));
rgb1(:,:,3)=adaptivethreah(rgb(:,:,3));
imshow(rgb1);