LUKEによる日本語感情分析(ソースコードと実行結果)

日本国憲法の分析結果
プログラム利用ガイド
1. このプログラムの利用シーン
日本語で書かれた文章の感情を分析するためのソフトウェアである。小説や日記、SNS投稿などのテキストファイルを読み込み、文章ごとの感情を8種類に分類する。文章全体を通した感情の変化をグラフで確認できるため、物語の展開や文章の感情的な構成を把握する際に利用できる。
2. 主な機能
- 8種類の感情分類: 各文章を「喜び」「悲しみ」「期待」「驚き」「怒り」「恐れ」「嫌悪」「信頼」の8つの感情に分類し、それぞれのスコア(0.0〜1.0)を算出する。
- 感情変化グラフ: 文章番号を横軸、感情スコアを縦軸としたグラフを生成する。各文章で最も強い感情が色分けして表示される。
- 変化点検出: 感情の傾向が変わる箇所を統計的に検出し、グラフ上に縦線で表示する。
- 結果の保存: 分析結果をテキストファイル(result.txt)とグラフ画像(emotion_graph.png)として保存する。
3. 基本的な使い方
- 事前準備:
以下のコマンドで必要なライブラリをインストールする。
pip install transformers matplotlib japanize-matplotlib numpy ruptures - プログラムの起動:
Pythonでプログラムを実行すると、ファイル選択ダイアログが表示される。分析したいテキストファイル(.txt形式、UTF-8エンコーディング)を選択する。
- 閾値の設定:
コンソールに閾値の入力を求めるメッセージが表示される。0.0〜1.0の範囲で数値を入力する。未入力の場合は0.1が適用される。この閾値以上のスコアを持つ感情が結果に★マークで表示される。
- 結果の確認:
分析が完了すると、コンソールに各文章の感情スコアが表示される。その後、感情変化グラフのウィンドウが開く。
- 終了方法:
グラフウィンドウを閉じるとプログラムが終了する。結果ファイルはプログラムと同じディレクトリに保存される。
4. 便利な機能
- 閾値による絞り込み: 閾値を高く設定すると、強い感情のみが★マークで強調される。分析の目的に応じて調整できる。
- 変化点の活用: グラフ上の変化点(縦の破線)は、物語の転換点や感情の切り替わりを示す。文章構成の分析に利用できる。
- 統計情報の確認: result.txtには感情の分布や平均スコアなどの統計情報が記録される。複数のテキストを比較分析する際に参照できる。
- GPU対応: CUDA対応のGPUが利用可能な環境では自動的にGPUが使用され、処理時間が短縮される。
Python開発環境,ライブラリ類
ここでは、最低限の事前準備について説明する。機械学習や深層学習を行う場合は、NVIDIA CUDA、Visual Studio、Cursorなどを追加でインストールすると便利である。これらについては別ページ https://www.kkaneko.jp/cc/dev/aiassist.htmlで詳しく解説しているので、必要に応じて参照してください。
Python 3.12 のインストール
Pythonのインストールを行い、Pythonのプログラムを実行する環境を整える。扱う環境は、Windows搭載パソコンである。金子研究室では、Python 3.12.10を推奨する。
[Windows での Python 3.12 のインストール手順を見るには、ここをクリック]
Windows での Python 3.12 のインストール
以下のいずれかの方法でPython 3.12をインストールする。Pythonがインストール済みの場合、この手順は不要である。
方法 1:winget によるインストール
【インストールコマンドの実行方法】
管理者権限でコマンドプロンプトを起動する(手順:Windowsキーまたはスタートメニュー → cmd と入力 → 右クリック → 「管理者として実行」)。そして、コマンド全体をコマンドプロンプトにコピー&ペーストする。
--scope machine を指定することで、システム全体(全ユーザー向け)にインストールされる。このオプションの実行には管理者権限が必要である。インストール完了後、コマンドプロンプトを再起動するとPATHが反映される。
REM Python 3.12 をシステム領域にインストール
winget install --id Python.Python.3.12 -e --scope machine --silent --accept-source-agreements --accept-package-agreements --override "/quiet InstallAllUsers=1 PrependPath=1 Include_test=0 Include_pip=1 Include_launcher=1 InstallLauncherAllUsers=1 TargetDir=\"C:\Program Files\Python312\""

REM Python と Scripts を PATH 先頭に追加
powershell -NoProfile -Command "$p='C:\Program Files\Python312'; $s=\"$p\Scripts\"; $c=[Environment]::GetEnvironmentVariable('Path','Machine'); if((Test-Path $p) -and (';'+$c+';' -notlike \"*;$p;*\") -and (';'+$c+';' -notlike \"*;$s;*\")){[Environment]::SetEnvironmentVariable('Path',\"$p;$s;$c\",'Machine')}"
方法 2:インストーラーによるインストール
- Python公式サイト(https://www.python.org/downloads/)にアクセスし、「Download Python 3.x.x」ボタンからWindows用インストーラーをダウンロードする。
- ダウンロードしたインストーラーを実行する。
- 初期画面の下部に表示される「Add python.exe to PATH」にチェックを入れてから「Customize installation」を選択する。このチェックを入れ忘れると、コマンドプロンプトから
pythonコマンドを実行できない。 - 「Install Python 3.xx for all users」にチェックを入れ、「Install」をクリックする。
インストールの確認
コマンドプロンプトで以下を実行する。
python --versionバージョン番号(例:Python 3.12.x)が表示されればインストール成功である。「'python' は、内部コマンドまたは外部コマンドとして認識されていません。」と表示される場合は、インストールが正常に完了していない。
Python の開発環境 Visual Studio Code のインストールと Python 用の設定
Python の開発環境Visual Studio Code(プログラムを編集するソフトウェア。以下、VS Code)を整える。
[Windows での Visual Studio Code のインストールと Python 用の設定手順を見るには、ここをクリック]
Windows での Visual Studio Code のインストールと Python 用の設定手順
1. VS Code と拡張機能のインストール
以下のコマンドにより,既存の VS Code を削除し,全ユーザー共有の設定で再インストールしたうえで,拡張機能(VS Code に機能を追加するソフトウェア)をまとめて導入する.
【インストールコマンドの実行方法】
管理者権限でコマンドプロンプトを起動する(手順:Windows キーまたはスタートメニュー → cmd と入力 → 右クリック → 「管理者として実行」)。そして,コマンド全体をコマンドプロンプトにコピー&ペーストする。
インストールコマンド
REM ============================================================
REM Microsoft Visual Studio Code
REM ============================================================
winget uninstall -e --id Microsoft.VisualStudioCode --silent --disable-interactivity --accept-source-agreements
rmdir /s /q C:\ProgramData\vscode-extensions 2>nul
rmdir /s /q "%APPDATA%\Code" 2>nul
rmdir /s /q "%USERPROFILE%\.vscode" 2>nul
rmdir /s /q "%LOCALAPPDATA%\Microsoft\vscode-update" 2>nul

REM VS Code をシステム領域に新規インストール
winget install --scope machine --id Microsoft.VisualStudioCode -e --silent --accept-source-agreements --accept-package-agreements

REM 全ユーザー共有の拡張機能フォルダ
mkdir C:\ProgramData\vscode-extensions 2>nul
icacls "C:\ProgramData\vscode-extensions" /grant "Everyone:(OI)(CI)M" /T

REM スタートメニューのショートカットを --extensions-dir 付きで再作成
rmdir /s /q "C:\ProgramData\Microsoft\Windows\Start Menu\Programs\Visual Studio Code" 2>nul
del "C:\ProgramData\Microsoft\Windows\Start Menu\Programs\Visual Studio Code.lnk" 2>nul
powershell -NoProfile -Command "$s=New-Object -ComObject WScript.Shell; $lnk=$s.CreateShortcut('C:\ProgramData\Microsoft\Windows\Start Menu\Programs\Visual Studio Code.lnk'); $lnk.TargetPath='C:\Program Files\Microsoft VS Code\Code.exe'; $lnk.Arguments='--extensions-dir \"C:\ProgramData\vscode-extensions\"'; $lnk.Save()"
REM ショートカットの検証
powershell -NoProfile -Command "$s=New-Object -ComObject WScript.Shell; $lnk=$s.CreateShortcut('C:\ProgramData\Microsoft\Windows\Start Menu\Programs\Visual Studio Code.lnk'); Write-Host 'TargetPath:' $lnk.TargetPath; Write-Host 'Arguments:' $lnk.Arguments"

REM ファイル / フォルダ右クリックの「Code で開く」を登録
reg add "HKLM\SOFTWARE\Classes\*\shell\VSCode\command" /ve /d "\"C:\Program Files\Microsoft VS Code\Code.exe\" --extensions-dir \"C:\ProgramData\vscode-extensions\" \"%1\"" /f
reg add "HKLM\SOFTWARE\Classes\Directory\shell\VSCode\command" /ve /d "\"C:\Program Files\Microsoft VS Code\Code.exe\" --extensions-dir \"C:\ProgramData\vscode-extensions\" \"%1\"" /f
reg add "HKLM\SOFTWARE\Classes\Directory\Background\shell\VSCode\command" /ve /d "\"C:\Program Files\Microsoft VS Code\Code.exe\" --extensions-dir \"C:\ProgramData\vscode-extensions\" \"%V\"" /f

REM --extensions-dir 付きで起動する code.cmd ラッパを作成
REM (%* を echo で書くと対話的 cmd で失われるため、PowerShell で [char]37+'*' を書き出す)
powershell -NoProfile -Command "$pct=[char]37; $q=[char]34; $c='@echo off'+[char]13+[char]10+$q+'C:\Program Files\Microsoft VS Code\bin\code.cmd'+$q+' --extensions-dir '+$q+'C:\ProgramData\vscode-extensions'+$q+' '+$pct+'*'+[char]13+[char]10; [IO.File]::WriteAllText('C:\ProgramData\vscode-extensions\vscode.cmd',$c,[Text.Encoding]::ASCII)"

REM 拡張機能のインストール
set "CODE=C:\Program Files\Microsoft VS Code\bin\code.cmd"
"%CODE%" --extensions-dir "C:\ProgramData\vscode-extensions" --uninstall-extension GitHub.copilot
"%CODE%" --extensions-dir "C:\ProgramData\vscode-extensions" --uninstall-extension GitHub.copilot-chat
"%CODE%" --extensions-dir "C:\ProgramData\vscode-extensions" --install-extension ms-python.python
"%CODE%" --extensions-dir "C:\ProgramData\vscode-extensions" --install-extension ms-python.vscode-pylance
"%CODE%" --extensions-dir "C:\ProgramData\vscode-extensions" --install-extension ms-python.debugpy
"%CODE%" --extensions-dir "C:\ProgramData\vscode-extensions" --install-extension MS-CEINTL.vscode-language-pack-ja
"%CODE%" --extensions-dir "C:\ProgramData\vscode-extensions" --install-extension saoudrizwan.claude-dev
"%CODE%" --extensions-dir "C:\ProgramData\vscode-extensions" --install-extension rust-lang.rust-analyzer
"%CODE%" --extensions-dir "C:\ProgramData\vscode-extensions" --install-extension tamasfe.even-better-toml
"%CODE%" --extensions-dir "C:\ProgramData\vscode-extensions" --install-extension anthropic.claude-code
"%CODE%" --extensions-dir "C:\ProgramData\vscode-extensions" --install-extension almenon.arepl
"%CODE%" --extensions-dir "C:\ProgramData\vscode-extensions" --list-extensions --show-versions
echo === セットアップ完了 ===
2. Python インタプリタの選択
同一マシンに複数の Python がインストールされている場合,VS Code で使用する Python 本体(インタプリタ:Python プログラムを解釈・実行するソフトウェア)を選択する必要がある.
- コマンドパレット(コマンド名で機能を呼び出す VS Code の入力欄)を開く(
Ctrl+Shift+P) Python: Select Interpreterと入力する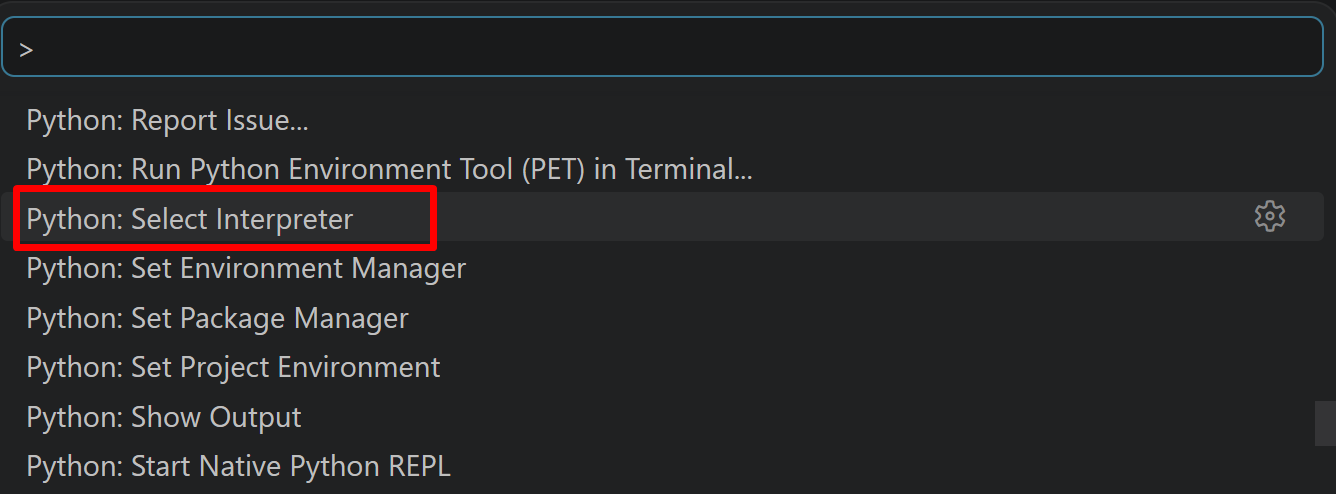
- 表示される一覧から,使用する Python(例:
C:\Program Files\Python312\python.exe)を選択する.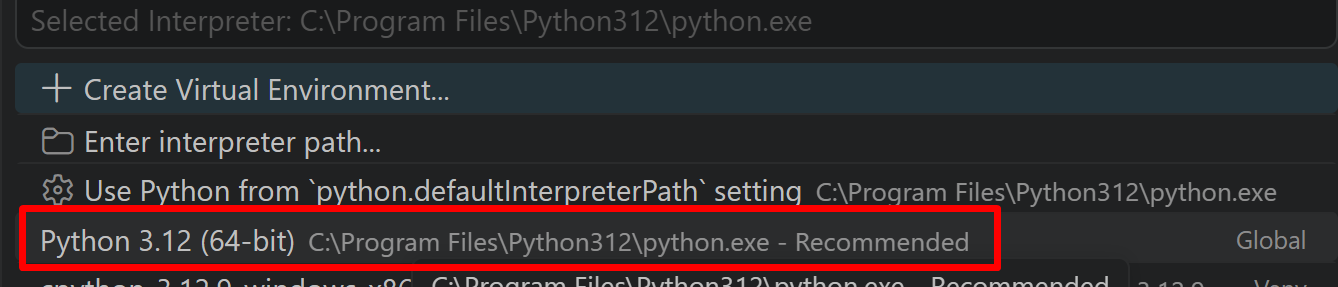
必要なライブラリをシステム領域にインストール
管理者権限のコマンドプロンプトで以下を実行する。管理者権限のコマンドプロンプトを起動するには、Windows キーまたはスタートメニューから「cmd」と入力し、表示された「コマンドプロンプト」を右クリックして「管理者として実行」を選択する。
REM PyTorch をインストール(GPU対応版)
set "CUDA_TAG=cu128"
set "PYTHON_PATH=C:\Program Files\Python312"
"%PYTHON_PATH%\Scripts\pip" install --no-user -U numpy torch torchvision torchaudio --index-url https://download.pytorch.org/whl/%CUDA_TAG%
pip install transformers matplotlib japanize-matplotlib numpy ruptures
LUKE日本語感情分析プログラム
1. 概要
このプログラムは、日本語テキストから8種類の感情(喜び、悲しみ、期待、驚き、怒り、恐れ、嫌悪、信頼)を自動的に分類する。各文章に対して感情スコアを算出し、文章全体の感情変化をグラフとして可視化する。
2. 主要技術
LUKE (Language Understanding with Knowledge-based Embeddings)
Yamadaらが2020年に発表した事前学習モデルである[1]。文中の単語とエンティティを独立したトークンとして扱い、エンティティ認識型自己注意機構により各トークンの文脈を考慮した表現を生成する。本プログラムでは、LUKEの日本語版をWRIMEデータセットでファインチューニングしたモデル(Mizuiro-sakura/luke-japanese-large-sentiment-analysis-wrime)を使用する。
WRIMEデータセット
Kajiwaraらが2021年に公開した日本語感情分析用データセットである[2]。Plutchikの感情モデルに基づく8種類の感情カテゴリ(喜び、悲しみ、期待、驚き、怒り、恐れ、嫌悪、信頼)に対して、主観的・客観的の両方のアノテーションが付与されている。
3. 技術的特徴
- Transformerベースの感情分類
入力テキストをLUKEトークナイザーで処理し、Transformerモデルで特徴抽出を行う。8感情分類ヘッドで各感情の生スコアを計算し、ソフトマックス関数で確率値に変換する。
- PELTアルゴリズムによる変化点検出
rupturesライブラリのPELT(Pruned Exact Linear Time)アルゴリズム[3]を使用し、感情変化の統計的な変化点を検出する。L2コストモデルを適用し、ペナルティ値は文章数に基づいて動的に設定される。
- バッチ処理による推論
複数の文章を一括でトークン化し、バッチ単位(デフォルト8文章)で推論を実行する。GPU使用時は並列処理により処理時間を短縮する。
- ラベル写像機構
モデルが出力するラベル順序と、プログラム内部で使用する固定順序(CANONICAL_LABELS)との間で動的に写像を行う。英語・日本語両方のラベル表記に対応する。
4. 実装の特色
本プログラムは以下の機能を備える:
- tkinterによるファイル選択ダイアログ
- 閾値設定による感情フィルタリング(0.0-1.0の範囲で指定可能)
- カラーユニバーサルデザインに対応した8色の感情表示
- 感情変化グラフのPNG形式での保存(emotion_graph.png)
- 詳細な分析結果のテキスト形式での保存(result.txt)
- GPU/CPUの自動選択によるデバイス最適化
5. 参考文献
[1] Yamada, I., Asai, A., Shindo, H., Takeda, H., & Matsumoto, Y. (2020). LUKE: Deep Contextualized Entity Representations with Entity-aware Self-attention. In Proceedings of the 2020 Conference on Empirical Methods in Natural Language Processing (EMNLP), pages 6442–6454. https://aclanthology.org/2020.emnlp-main.523/
[2] Kajiwara, T., Chu, C., Takemura, N., Nakashima, Y., & Nagahara, H. (2021). WRIME: A New Dataset for Emotional Intensity Estimation with Subjective and Objective Annotations. In Proceedings of the 2021 Conference of the North American Chapter of the Association for Computational Linguistics: Human Language Technologies, pages 2095–2104. https://aclanthology.org/2021.naacl-main.169/
[3] Killick, R., Fearnhead, P., & Eckley, I. A. (2012). Optimal Detection of Changepoints With a Linear Computational Cost. Journal of the American Statistical Association, 107(500), 1590-1598. https://doi.org/10.1080/01621459.2012.737745
ソースコード
# プログラム名: LUKE日本語感情分析プログラム
# 特徴技術名: LUKE (Language Understanding with Knowledge-based Embeddings)
# 出典: Yamada, I., Asai, A., Shindo, H., Takeda, H., & Matsumoto, Y. (2020). LUKE: Deep Contextualized Entity Representations with Entity-aware Self-attention. In Proceedings of the 2020 Conference on Empirical Methods in Natural Language Processing (EMNLP), pages 6442–6454.
# 特徴機能: エンティティ認識型自己注意機構により、文中の単語とエンティティを独立したトークンとして扱い、それぞれの文脈を考慮した表現を出力する機能
# 学習済みモデル: Mizuiro-sakura/luke-japanese-large-sentiment-analysis-wrime - LUKEの日本語版をWRIMEデータセットで8感情分類にファインチューニングしたモデル
# 方式設計:
# 関連利用技術: Transformers(Hugging Face)、PyTorch、NumPy、matplotlib、japanize-matplotlib、ruptures
# 入力と出力: 入力: テキストファイル(tkinterでファイル選択)、出力: 感情分析結果をprint()で表示、matplotlibで感情変化グラフ表示、終了時result.txt保存
# 処理手順: テキスト読み込み→文章分割→感情分類→スコア計算→変化点検出→グラフ生成
# 前処理、後処理: テキスト正規化、トークン化、ソフトマックス確率変換
# 追加処理: 閾値処理による文章抽出、感情変化点検出処理 - rupturesライブラリによる統計的変化点検出
# 調整を必要とする設定値: 閾値設定(0.0-1.0)
# 将来方策: 変化点検出の感度を文章全体の感情変化の分散から動的に決定
# その他の重要事項: 8感情順番固定(喜び0、悲しみ1、期待2、驚き3、怒り4、恐れ5、嫌悪6、信頼7)、グラフは各文章の最大感情のみ表示
# 前準備
# pip install transformers matplotlib japanize-matplotlib numpy ruptures
from transformers import AutoTokenizer, AutoModelForSequenceClassification
import torch
import numpy as np
import tkinter as tk
from tkinter import filedialog
import matplotlib.pyplot as plt
import japanize_matplotlib
import ruptures as rpt
import re
from collections import Counter
import sys
# matplotlibの設定
plt.rcParams['figure.figsize'] = (20, 12)
plt.rcParams['font.size'] = 12
plt.rcParams['axes.grid'] = True
plt.rcParams['grid.alpha'] = 0.3
# 設定値
MAX_SEQ_LENGTH = 512 # トークナイザーの最大シーケンス長
BATCH_SIZE = 8 # バッチ処理のサイズ
# 感情の色定義(RGB形式、0-1の範囲)- カラーユニバーサルデザイン対応(CANONICAL順)
EMOTION_COLORS = [
(0.9, 0.2, 0.2), # 明るい赤(喜び)
(0.2, 0.4, 0.8), # 明るい青(悲しみ)
(0.2, 0.8, 0.2), # 明るい緑(期待)
(0.0, 0.8, 0.8), # シアン(驚き)
(0.8, 0.0, 0.0), # 濃い赤(怒り)
(0.6, 0.2, 0.8), # 紫(恐れ)
(0.8, 0.6, 0.0), # オレンジ(嫌悪)
(0.3, 0.6, 1.0) # 水色(信頼)
]
print('=' * 60)
print('LUKE日本語感情分析プログラム')
print('=' * 60)
print('\n【概要】')
print('本プログラムはLUKEモデルを使用してテキストの感情を8種類に分類する')
print('文章ごとに感情を分析し、感情の変化点を統計的に検出する')
print('\n【使用方法】')
print('1. テキストファイルを選択する')
print('2. 閾値を設定する(0.0-1.0、デフォルト: 0.1)')
print('3. 分析結果が表示される')
print('4. グラフウィンドウを閉じるとプログラムを終了する')
print('\n【出力ファイル】')
print('- emotion_graph.png: 感情変化グラフ')
print('- result.txt: 詳細な分析結果')
print('=' * 60 + '\n')
# GPU/CPU自動選択
device = torch.device('cuda' if torch.cuda.is_available() else 'cpu')
print(f'使用デバイス: {device}')
# モデルとトークナイザーの読み込み
print('LUKEモデルを読み込み中...')
try:
tokenizer = AutoTokenizer.from_pretrained('Mizuiro-sakura/luke-japanese-large-sentiment-analysis-wrime')
model = AutoModelForSequenceClassification.from_pretrained('Mizuiro-sakura/luke-japanese-large-sentiment-analysis-wrime')
model = model.to(device)
model.eval() # 評価モードに設定
print('モデル読み込み完了\n')
except Exception as e:
print(f'モデルの読み込みに失敗しました: {e}')
sys.exit(1)
# ラベル動的取得と写像の初期化(CANONICAL順に統一)
CANONICAL_LABELS = ['喜び', '悲しみ', '期待', '驚き', '怒り', '恐れ', '嫌悪', '信頼']
# 英日エイリアス
LABEL_ALIAS = {
'joy': '喜び', '喜び': '喜び',
'sadness': '悲しみ', '悲しみ': '悲しみ',
'anticipation': '期待', 'expectation': '期待', '期待': '期待',
'surprise': '驚き', '驚き': '驚き',
'anger': '怒り', '怒り': '怒り',
'fear': '恐れ', '恐れ': '恐れ',
'disgust': '嫌悪', '嫌悪': '嫌悪',
'trust': '信頼', '信頼': '信頼',
}
def _normalize_label(s: str) -> str:
s = str(s).strip()
ascii_only = all(ord(ch) < 128 for ch in s)
return s.lower() if ascii_only else s
try:
id2label = model.config.id2label
except Exception as e:
print(f'警告: id2labelを取得できなかったため暫定対応を行う: {e}')
id2label = {i: CANONICAL_LABELS[i] for i in range(len(CANONICAL_LABELS))}
# キー整列(intキー/数字文字列キーを考慮)
_keys = list(id2label.keys())
if all(isinstance(k, int) for k in _keys):
index_keys = sorted(_keys)
elif all(isinstance(k, str) and k.isdigit() for k in _keys):
index_keys = sorted(_keys, key=lambda k: int(k))
else:
try:
index_keys = sorted(_keys, key=lambda k: int(k))
except Exception:
index_keys = sorted(_keys, key=lambda k: str(k))
model_labels_raw = [id2label[k] for k in index_keys]
canon_label_to_idx = {lab: i for i, lab in enumerate(CANONICAL_LABELS)}
model_idx_to_canon_idx = []
unknown_labels = []
for i, raw in enumerate(model_labels_raw):
key = _normalize_label(raw)
if key not in LABEL_ALIAS:
unknown_labels.append(str(raw))
# 警告のみで続行。暫定として位置対応で割当
mapped_idx = i if i < len(CANONICAL_LABELS) else (len(CANONICAL_LABELS) - 1)
else:
canon = LABEL_ALIAS[key]
mapped_idx = canon_label_to_idx[canon]
model_idx_to_canon_idx.append(mapped_idx)
# 逆写像(固定順→モデル順)
canon_idx_to_model_idx = [None] * len(CANONICAL_LABELS)
for m_idx, c_idx in enumerate(model_idx_to_canon_idx):
if 0 <= c_idx < len(CANONICAL_LABELS) and (canon_idx_to_model_idx[c_idx] is None):
canon_idx_to_model_idx[c_idx] = m_idx
# 未割当があればフォールバックで穴埋め
for j in range(len(CANONICAL_LABELS)):
if canon_idx_to_model_idx[j] is None:
canon_idx_to_model_idx[j] = j if j < len(model_labels_raw) else (len(model_labels_raw) - 1)
if unknown_labels:
print(f'警告: 未知のラベルが検出されたため暫定写像で続行する: {unknown_labels}')
# 以降の表示用ラベル(固定順)
emotion_labels = CANONICAL_LABELS
# ファイル選択
root = tk.Tk()
root.withdraw()
file_path = filedialog.askopenfilename(title='テキストファイルを選択', filetypes=[('Text files', '*.txt')])
if not file_path:
print('ファイルが選択されていない')
sys.exit(0)
# テキスト読み込み
try:
with open(file_path, 'r', encoding='utf-8') as f:
text = f.read()
print(f'ファイル読み込み完了: {file_path}')
except Exception as e:
print(f'ファイルの読み込みに失敗しました: {e}')
sys.exit(1)
# 文章分割(複数の文末記号に対応)
sentences = re.split('[。!?!?]+', text)
sentences = [s.strip() for s in sentences if s.strip()]
print(f'文章数: {len(sentences)}')
if len(sentences) == 0:
print('分析可能な文章が見つからない')
sys.exit(0)
# 閾値設定(デフォルト0.1)
threshold_input = input('\n閾値を入力(0.0-1.0、未入力の場合は0.1): ').strip()
try:
threshold = float(threshold_input) if threshold_input else 0.1
threshold = max(0.0, min(1.0, threshold)) # クランプ処理
if threshold_input and (float(threshold_input) < 0.0 or float(threshold_input) > 1.0):
print(f'閾値を{threshold}に調整した')
except ValueError:
threshold = 0.1
print('無効な入力のため、閾値を0.1に設定した')
print(f'\n感情分析を開始する(閾値: {threshold})')
print('-' * 60)
# 感情分析実行(バッチ処理対応)
results = [] # 各文章の確率ベクトル(モデル順)
max_emotions = [] # 各文章の最大感情のインデックス(CANONICAL順)
max_scores = [] # 各文章の最大感情のスコア
# バッチ処理
for batch_start in range(0, len(sentences), BATCH_SIZE):
batch_end = min(batch_start + BATCH_SIZE, len(sentences))
batch_sentences = sentences[batch_start:batch_end]
# バッチトークン化
tokens = tokenizer(batch_sentences, truncation=True, max_length=MAX_SEQ_LENGTH,
padding=True, return_tensors='pt')
tokens = {k: v.to(device) for k, v in tokens.items()}
# バッチ推論
with torch.no_grad():
outputs = model(**tokens)
batch_scores = torch.softmax(outputs.logits, dim=-1).cpu().numpy()
# 各文章の結果
for i, (sentence, scores) in enumerate(zip(batch_sentences, batch_scores)):
sentence_idx = batch_start + i
results.append(scores) # モデル順ベクトルを保持
# 最大感情(モデル順→固定順に写像)
model_max_idx = int(np.argmax(scores))
max_score = float(scores[model_max_idx])
canonical_idx = model_idx_to_canon_idx[model_max_idx]
max_emotions.append(canonical_idx)
max_scores.append(max_score)
# 結果表示
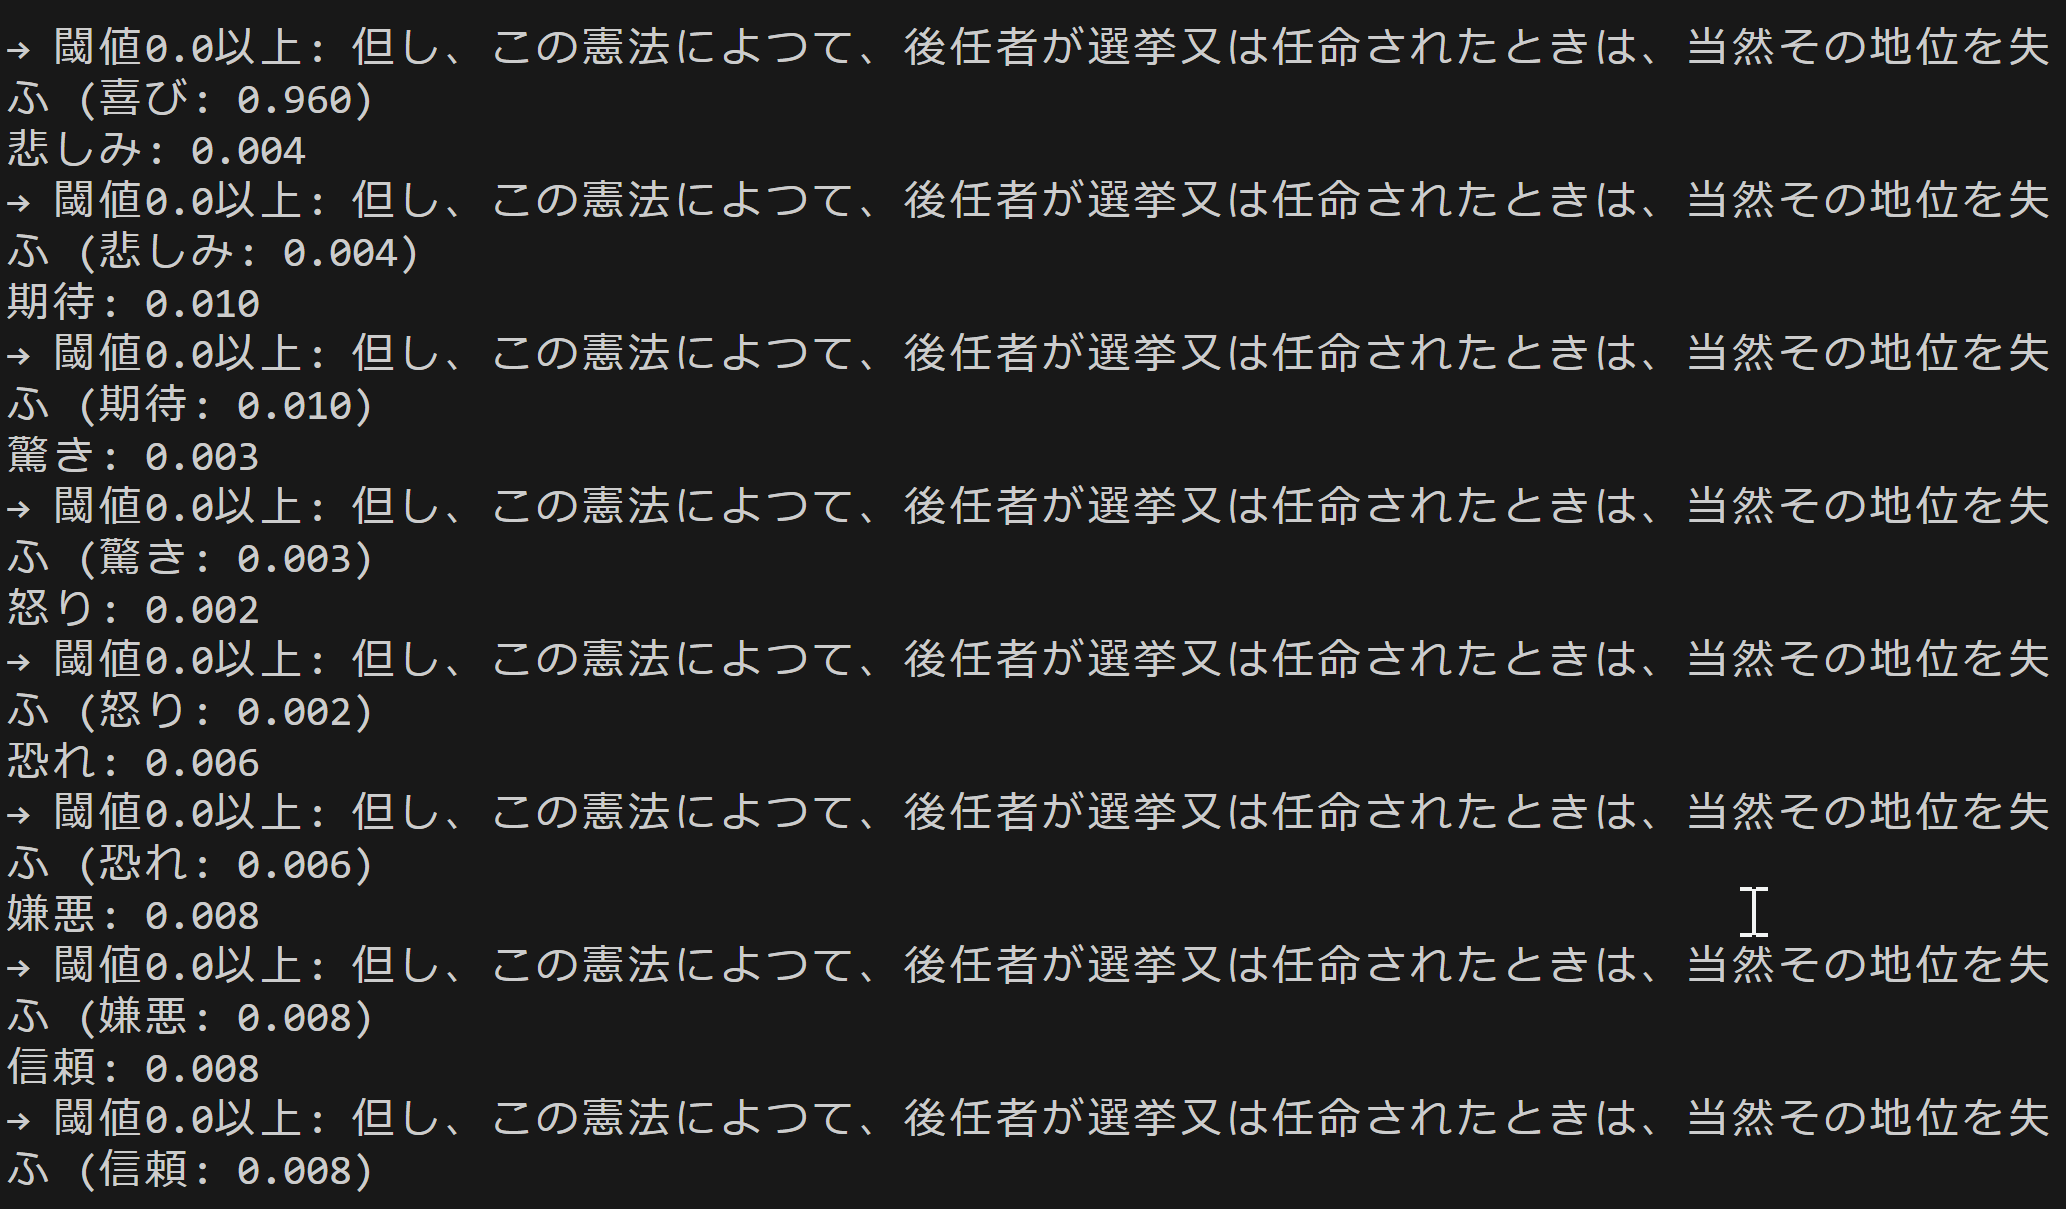
print(f'\n文章{sentence_idx + 1}: {sentence}')
# 閾値以上を明示(固定順で表示)
scores_by_canon = [float(scores[canon_idx_to_model_idx[j]]) for j in range(len(emotion_labels))]
threshold_exceeded = []
for j, (emotion, score) in enumerate(zip(emotion_labels, scores_by_canon)):
if score >= threshold:
print(f' {emotion}: {score:.3f} ★')
threshold_exceeded.append(f'{emotion}({score:.3f})')
else:
print(f' {emotion}: {score:.3f}')
if threshold_exceeded:
print(f' → 閾値{threshold}以上: {", ".join(threshold_exceeded)}')
def detect_emotion_change_points_statistical(signal, max_scores):
"""PELTアルゴリズム(model="l2")による変化点検出。
入力信号は各文章の8次元確率ベクトル(results)である。
max_scoresは説明用統計出力に利用する。"""
if len(max_scores) < 3:
return []
# signal: shape = (n_samples, 8) を前提
print(f'信号の形状: {signal.shape}')
print(f'最初の文章の8感情: {signal[0]}')
n_samples = len(max_scores)
# ペナルティ設定:2*log(n_samples) を8で割り、8次元信号に対するスケール調整とする
penalty = (2 * np.log(n_samples)) / 8
print('\n変化点検出パラメータ:')
print(f' 文章数: {n_samples}')
print(f' ペナルティ設定: 2*log({n_samples})/8 = {penalty:.3f}')
print('\n文章ごとの最大感情スコア:')
for i, score in enumerate(max_scores):
print(f' 文章{i+1}: {score:.3f}')
print('\n隣接文章間の最大スコア差分:')
for i in range(len(max_scores) - 1):
change = abs(max_scores[i+1] - max_scores[i])
print(f' 文章{i+1}→{i+2}: {change:.3f}')
if len(max_scores) > 1:
max_change = max(abs(max_scores[i+1] - max_scores[i]) for i in range(len(max_scores) - 1))
print(f'\n最大スコア差分: {max_change:.3f}')
print(f'使用ペナルティ値: {penalty:.3f}')
change_points = []
try:
algo = rpt.Pelt(model="l2").fit(signal)
change_points_raw = algo.predict(pen=penalty)
change_points = [cp for cp in change_points_raw[:-1]]
print(f' 検出された変化点数: {len(change_points)}個')
if len(change_points) > 0 and len(change_points) <= 30:
print(f' 変化点位置(文章番号): {change_points}')
except Exception as e:
print(f' 変化点検出エラー: {e}')
return change_points
print('\n' + '=' * 60)
print('感情変化の統計分析')
print('=' * 60)
# 感情変化点の検出
signal = np.array(results) # モデル順の生配列
change_points = detect_emotion_change_points_statistical(signal, max_scores)
# 基本統計量の表示
print(f'\n【感情スコアの統計】')
print(f' 平均スコア: {np.mean(max_scores):.3f}')
print(f' 標準偏差: {np.std(max_scores):.3f}')
print(f' 最小スコア: {np.min(max_scores):.3f}')
print(f' 最大スコア: {np.max(max_scores):.3f}')
# 最頻感情の計算(固定順インデックス)
emotion_counts = Counter(max_emotions)
max_count = max(emotion_counts.values()) if emotion_counts else 0
most_common_emotions = [emotion_labels[i] for i in range(len(emotion_labels))
if emotion_counts.get(i, 0) == max_count and max_count > 0]
print(f'\n【最頻感情】')
if len(most_common_emotions) == 1:
print(f' {most_common_emotions[0]} ({max_count}回)')
else:
if max_count > 0:
print(f' {", ".join(most_common_emotions)} (各{max_count}回、同数)')
else:
print(' なし')
# 感情の分布を表示(0回も表示、固定順)
print(f'\n【感情の分布】')
for i, lab in enumerate(emotion_labels):
count = emotion_counts.get(i, 0)
percentage = (count / len(sentences)) * 100
print(f' {lab}: {count}回 ({percentage:.1f}%)')
# matplotlibでグラフ生成
print('\n' + '=' * 60)
print('感情変化グラフを生成している...')
fig, ax = plt.subplots(figsize=(20, 12))
# 最大感情の折れ線グラフを描画
x_values = list(range(1, len(sentences) + 1))
# 各区間を異なる色で描画(CANONICAL順インデックスに基づく)
for i in range(len(sentences)):
if i < len(sentences) - 1:
ax.plot([x_values[i], x_values[i+1]],
[max_scores[i], max_scores[i+1]],
color=EMOTION_COLORS[max_emotions[i]],
linewidth=2.5,
marker='o',
markersize=8,
markerfacecolor=EMOTION_COLORS[max_emotions[i]],
markeredgecolor='white',
markeredgewidth=1.5)
else:
# 最後の点
ax.plot(x_values[i], max_scores[i],
marker='o',
markersize=8,
color=EMOTION_COLORS[max_emotions[i]],
markerfacecolor=EMOTION_COLORS[max_emotions[i]],
markeredgecolor='white',
markeredgewidth=1.5)
# 変化点を描画
if len(change_points) > 0:
for cp in change_points:
ax.axvline(x=cp, color='gray', linestyle='--', linewidth=2.5, alpha=0.7)
ax.text(cp, ax.get_ylim()[1] * 0.95, f'変化点{cp}',
color='gray', fontsize=10, ha='center', fontweight='bold')
print(f'グラフに{len(change_points)}個の変化点を描画した')
# 感情ラベルを点の近くに表示(文章数が少ない場合)
if len(sentences) <= 30:
for i in range(len(sentences)):
ax.annotate(emotion_labels[max_emotions[i]],
(x_values[i], max_scores[i]),
textcoords="offset points",
xytext=(0, 10),
ha='center',
fontsize=9,
color=EMOTION_COLORS[max_emotions[i]])
# 軸の設定
ax.set_xlabel('文章番号', fontsize=14)
ax.set_ylabel('感情スコア', fontsize=14)
ax.set_title('感情変化グラフ - 文章ごとの最大感情', fontsize=18, pad=20)
# Y軸の範囲を0-1に設定
ax.set_ylim(0, 1)
# X軸の目盛り設定
if len(sentences) <= 50:
ax.set_xticks(range(1, len(sentences) + 1, max(1, len(sentences) // 20)))
else:
ax.set_xticks(range(1, len(sentences) + 1, max(1, len(sentences) // 10)))
# グリッドの設定
ax.grid(True, alpha=0.3, linestyle='-', linewidth=0.5)
# 凡例の作成(CANONICAL順)
from matplotlib.patches import Patch
legend_elements = [Patch(facecolor=EMOTION_COLORS[i], label=f'{emotion_labels[i]}')
for i in range(len(emotion_labels))]
ax.legend(handles=legend_elements, loc='upper right', fontsize=11,
framealpha=0.9, ncol=2)
# 統計情報を表示
stats_text = f'文章数: {len(sentences)}\n'
stats_text += f'変化点数: {len(change_points)}\n'
stats_text += f'平均スコア: {np.mean(max_scores):.3f}\n'
stats_text += f'標準偏差: {np.std(max_scores):.3f}'
if len(most_common_emotions) == 1:
stats_text += f'\n最頻感情: {most_common_emotions[0]}'
else:
if most_common_emotions:
stats_text += f'\n最頻感情: {", ".join(most_common_emotions)}'
else:
stats_text += '\n最頻感情: なし'
ax.text(0.02, 0.98, stats_text, transform=ax.transAxes,
fontsize=10, verticalalignment='top',
bbox=dict(boxstyle='round', facecolor='white', alpha=0.8))
# レイアウトの調整
plt.tight_layout()
# グラフの保存
try:
plt.savefig('emotion_graph.png', dpi=150, bbox_inches='tight')
print('emotion_graph.pngに保存した')
except Exception as e:
print(f'グラフの保存に失敗した: {e}')
# グラフの表示
plt.show()
# 結果保存
save_success = False
try:
with open('result.txt', 'w', encoding='utf-8') as f:
f.write('LUKE日本語感情分析結果\n')
f.write('=' * 60 + '\n')
f.write(f'分析ファイル: {file_path}\n')
f.write(f'文章数: {len(sentences)}\n')
f.write(f'閾値: {threshold}\n')
f.write(f'検出された変化点数: {len(change_points)}\n')
if len(change_points) > 0 and len(change_points) <= 30:
f.write(f'変化点位置(文章番号): {change_points}\n')
f.write(f'\n【統計情報】\n')
f.write(f'平均感情スコア: {np.mean(max_scores):.3f}\n')
f.write(f'標準偏差: {np.std(max_scores):.3f}\n')
f.write(f'最小スコア: {np.min(max_scores):.3f}\n')
f.write(f'最大スコア: {np.max(max_scores):.3f}\n')
if len(most_common_emotions) == 1:
f.write(f'最頻感情: {most_common_emotions[0]}\n')
else:
if most_common_emotions:
f.write(f'最頻感情: {", ".join(most_common_emotions)}(同数)\n')
else:
f.write('最頻感情: なし\n')
f.write(f'\n【感情の分布】\n')
for i, lab in enumerate(emotion_labels):
count = emotion_counts.get(i, 0)
percentage = (count / len(sentences)) * 100
f.write(f'{lab}: {count}回 ({percentage:.1f}%)\n')
f.write(f'\n【詳細な分析結果】\n')
f.write('=' * 60 + '\n')
for i, (sentence, scores) in enumerate(zip(sentences, results)):
f.write(f'\n文章{i+1}: {sentence}\n')
scores_by_canon = [float(scores[canon_idx_to_model_idx[j]]) for j in range(len(emotion_labels))]
for emotion, score in zip(emotion_labels, scores_by_canon):
if score >= threshold:
f.write(f' {emotion}: {score:.3f} ★\n')
else:
f.write(f' {emotion}: {score:.3f}\n')
save_success = True
print('result.txtに保存した')
except Exception as e:
print(f'結果ファイルの保存に失敗した: {e}')
print('\n' + '=' * 60)
if save_success:
print('プログラムを正常終了する')
print('出力ファイル:')
print(' - emotion_graph.png (感情変化グラフ)')
print(' - result.txt (詳細な分析結果)')
else:
print('結果ファイルの保存に失敗したが、分析は完了した')
print('=' * 60)
実験・研究スキルの基礎:Windows で学ぶ感情分析実験
1. 実験・研究のスキル構成要素
実験や研究を行うには、以下の5つの構成要素を理解する必要がある。
1.1 実験用データ
このプログラムでは日本語テキストファイルが実験用データである。小説、日記、SNS投稿、ニュース記事など、様々な種類のテキストを分析対象とすることができる。
1.2 実験計画
何を明らかにするために実験を行うのかを定める。
計画例:
- 閾値が感情検出数に与える影響を確認する
- 文章の長さが感情分類の精度に与える影響を確認する
- 特定の感情(喜び、悲しみなど)を確実に検出する閾値設定を見つける
- 感情の変化点と物語の展開との対応関係を分析する
- 異なるジャンルのテキスト(小説、ニュース、SNS)で感情分布がどう異なるかを比較する
1.3 プログラム
実験を実施するためのツールである。このプログラムはHugging FaceのTransformersライブラリとLUKEモデル(Mizuiro-sakura/luke-japanese-large-sentiment-analysis-wrime)を使用している。
- プログラムの機能を理解して活用することが基本である
- 基本となるプログラムを出発点として、将来、様々な機能を自分で追加することができる
1.4 プログラムの機能
このプログラムは閾値パラメータで感情検出の表示を制御する。
入力パラメータ:
- 閾値:感情スコアを強調表示する基準値(0.0〜1.0)
出力情報:
- 各文章の8感情スコア(喜び、悲しみ、期待、驚き、怒り、恐れ、嫌悪、信頼)
- 閾値以上のスコアを持つ感情の★マーク表示
- 感情変化グラフ(横軸:文章番号、縦軸:感情スコア)
- 統計的に検出された感情変化点
- 感情分布の統計情報(平均、標準偏差、最頻感情)
閾値の動作:
- 閾値を変えると、強調表示される感情の数が変化する
- 閾値が低いほど多くの感情が強調され、高いほど強い感情のみが強調される
1.5 検証(結果の確認と考察)
プログラムの実行結果を観察し、パラメータの影響を考察する。
基本認識:
- パラメータを変えると結果が変わる。その変化を観察することが実験である
- 「良い結果」「悪い結果」は目的によって異なる
観察のポイント:
- 閾値以上の感情はいくつ検出されるか
- 最も強い感情は文章の内容と一致しているか
- 感情変化点は物語や文章の転換点と対応しているか
- 複数の感情が同程度のスコアを持つ文章はあるか
- 感情スコアの分布に偏りはあるか
2. 間違いの原因と対処方法
2.1 プログラムのミス(人為的エラー)
プログラムがエラーで停止する
- 原因:構文エラー、必要なライブラリがインストールされていない
- 対処方法:エラーメッセージを確認し、提供されたコードと比較する
ファイル選択ダイアログが表示されない
- 原因:tkinterがGoogle Colab環境で動作しない
- 対処方法:Google Colab用にファイルアップロード機能を使用するようコードを修正する
モデルのダウンロードに時間がかかる
- 原因:初回実行時にLUKEモデルをダウンロードしている
- 対処方法:これは正常な動作である。ダウンロードが完了するまで待つ
文字化けが発生する
- 原因:テキストファイルのエンコーディングがUTF-8でない
- 対処方法:テキストファイルをUTF-8形式で保存し直す
2.2 期待と異なる結果が出る場合
閾値を変えても強調表示される感情が変化しない
- 原因:元々のスコアが全て低い、または一つの感情が突出して高い
- 対処方法:閾値を0.05から0.5まで大きく変化させて観察する
文章の内容と検出された感情が一致しない
- 原因:皮肉や比喩表現、文脈依存の感情表現をモデルが正しく解釈できていない
- 対処方法:これは現在の感情分析技術の限界である。どのような表現で誤分類が起きやすいか記録する
全ての文章で同じ感情が最大になる
- 原因:テキスト全体の感情傾向が均一である、または特定の感情に偏ったテキストである
- 対処方法:感情の変化が明確なテキスト(物語の起承転結があるものなど)で再実験する
変化点が検出されない
- 原因:文章数が少なすぎる(3文未満)、または感情変化が緩やかである
- 対処方法:より長いテキストを使用する。変化点検出は統計的手法であり、一定のデータ量が必要である
グラフが表示されない
- 原因:matplotlibの日本語フォント設定が正しくない
- 対処方法:japanize-matplotlibが正しくインストールされているか確認する
3. 実験レポートのサンプル
閾値設定と感情検出精度の関係分析
実験目的:
テキスト内の主要な感情を漏れなく検出しながら、ノイズとなる弱い感情を除外するための閾値を見つける。
実験計画:
同一テキストに対して閾値を変化させ、検出される感情の数と内容を記録する。
実験方法:
プログラムを実行し、閾値を変化させながら以下の基準で評価する:
- 検出感情数:閾値以上のスコアを持つ感情の総数
- 主要感情一致率:文章の内容と最大感情が一致している文章の割合
- ノイズ率:内容と無関係な感情が検出された割合
実験結果:
| 閾値 | 検出感情数(平均) | 主要感情一致率 | ノイズ率 | 総合評価 |
|---|---|---|---|---|
| xxxx | x | x% | x% | x |
| xxxx | x | x% | x% | x |
| xxxx | x | x% | x% | x |
| xxxx | x | x% | x% | x |
考察:
- (例文)閾値xxxxでは検出感情数が多く、文章ごとに複数の感情が強調表示された。しかし、内容と無関係な感情も多く含まれており、分析が煩雑になった
- (例文)閾値xxxxでは主要感情一致率が高く、文章の内容を反映した感情が検出された。複数の感情が混在する文章でも適切に識別できた
- (例文)閾値xxxx以上では検出感情数が減少し、強い感情のみが表示された。微妙な感情の変化を見逃す可能性がある
- (例文)閾値を上げるほどノイズは減るが、同時に検出される感情の多様性も減少するというトレードオフの関係が確認できた
結論:
(例文)本実験のテキストにおいては、閾値xxxxが主要感情の検出とノイズ除去のバランスが取れた設定であった。感情の細かな変化を分析したい場合はxxxxを、明確な感情傾向のみを把握したい場合はxxxxが適切である。テキストの性質や分析目的に応じて閾値を調整する必要性が確認できた。