SLIC (scikit-image に含まれる)のインストールと動作確認(スーパーピクセル)(Python を使用)(Windows 上)
【関連する外部ページ】
スーパーピクセルに関する参考記事: http://scikit-image.org/docs/dev/auto_examples/segmentation/plot_segmentations.html
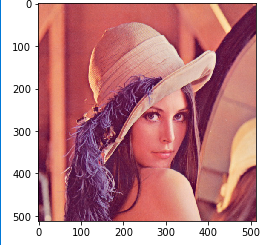
元画像
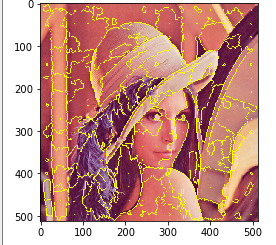
SLIC
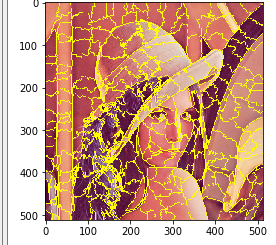
felzenszwalb
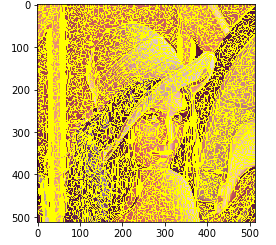
quickshift
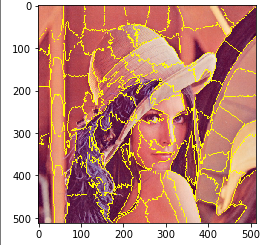
watershed
前準備
Python 3.12 のインストール
Pythonのインストールを行い、Pythonのプログラムを実行する環境を整える。扱う環境は、Windows搭載パソコンである。金子研究室では、Python 3.12.10を推奨する。
[Windows での Python 3.12 のインストール手順を見るには、ここをクリック]
Windows での Python 3.12 のインストール
以下のいずれかの方法でPython 3.12をインストールする。Pythonがインストール済みの場合、この手順は不要である。
方法 1:winget によるインストール
【インストールコマンドの実行方法】
管理者権限でコマンドプロンプトを起動する(手順:Windowsキーまたはスタートメニュー → cmd と入力 → 右クリック → 「管理者として実行」)。そして、コマンド全体をコマンドプロンプトにコピー&ペーストする。
--scope machine を指定することで、システム全体(全ユーザー向け)にインストールされる。このオプションの実行には管理者権限が必要である。インストール完了後、コマンドプロンプトを再起動するとPATHが反映される。
REM Python 3.12 をシステム領域にインストール
winget install --id Python.Python.3.12 -e --scope machine --silent --accept-source-agreements --accept-package-agreements --override "/quiet InstallAllUsers=1 PrependPath=1 Include_test=0 Include_pip=1 Include_launcher=1 InstallLauncherAllUsers=1 TargetDir=\"C:\Program Files\Python312\""

REM Python と Scripts を PATH 先頭に追加
powershell -NoProfile -Command "$p='C:\Program Files\Python312'; $s=\"$p\Scripts\"; $c=[Environment]::GetEnvironmentVariable('Path','Machine'); if((Test-Path $p) -and (';'+$c+';' -notlike \"*;$p;*\") -and (';'+$c+';' -notlike \"*;$s;*\")){[Environment]::SetEnvironmentVariable('Path',\"$p;$s;$c\",'Machine')}"
方法 2:インストーラーによるインストール
- Python公式サイト(https://www.python.org/downloads/)にアクセスし、「Download Python 3.x.x」ボタンからWindows用インストーラーをダウンロードする。
- ダウンロードしたインストーラーを実行する。
- 初期画面の下部に表示される「Add python.exe to PATH」にチェックを入れてから「Customize installation」を選択する。このチェックを入れ忘れると、コマンドプロンプトから
pythonコマンドを実行できない。 - 「Install Python 3.xx for all users」にチェックを入れ、「Install」をクリックする。
インストールの確認
コマンドプロンプトで以下を実行する。
python --versionバージョン番号(例:Python 3.12.x)が表示されればインストール成功である。「'python' は、内部コマンドまたは外部コマンドとして認識されていません。」と表示される場合は、インストールが正常に完了していない。
SLIC (scikit-image) のインストール
- 以下のコマンドを管理者権限のコマンドプロンプトで実行する
(手順:Windowsキーまたはスタートメニュー →
cmdと入力 → 右クリック → 「管理者として実行」)。
次のコマンドを実行する.
python -m pip install -U scikit-image matplotlib
スーパーピクセルの実行(scikit-image の SLIC,Python を使用)
SLIC
SLIC を行う Python プログラムを実行してみる.
- Python プログラムを実行する..Matplotlib を使うので,Jupyter QtConsole や Jupyter ノートブック (Jupyter Notebook) の利用が便利である.
- Python プログラムを実行する
%matplotlib inline
import matplotlib.pyplot as plt
import warnings
warnings.filterwarnings('ignore')   # Suppress Matplotlib warnings
import skimage.data
import skimage.color
import skimage.filters
import skimage.util
import skimage.segmentation
img = skimage.util.img_as_float( plt.imread("d:\lena_std.jpg") )
plt.imshow(img)

a = skimage.segmentation.slic(img)
plt.imshow( a )

plt.imshow( skimage.segmentation.mark_boundaries(img, a) )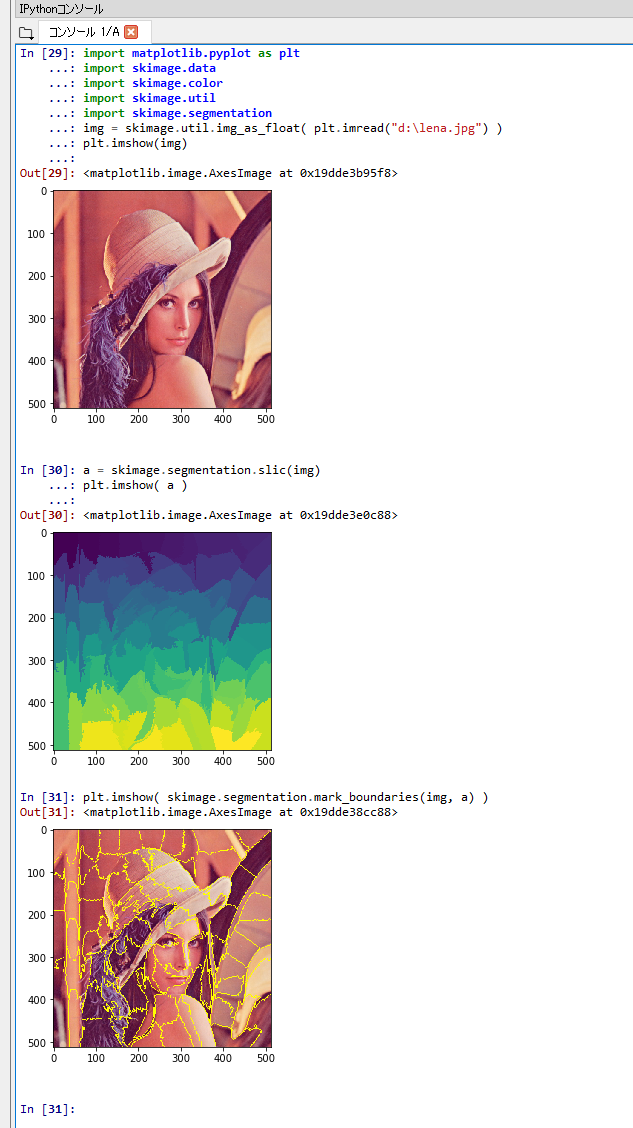
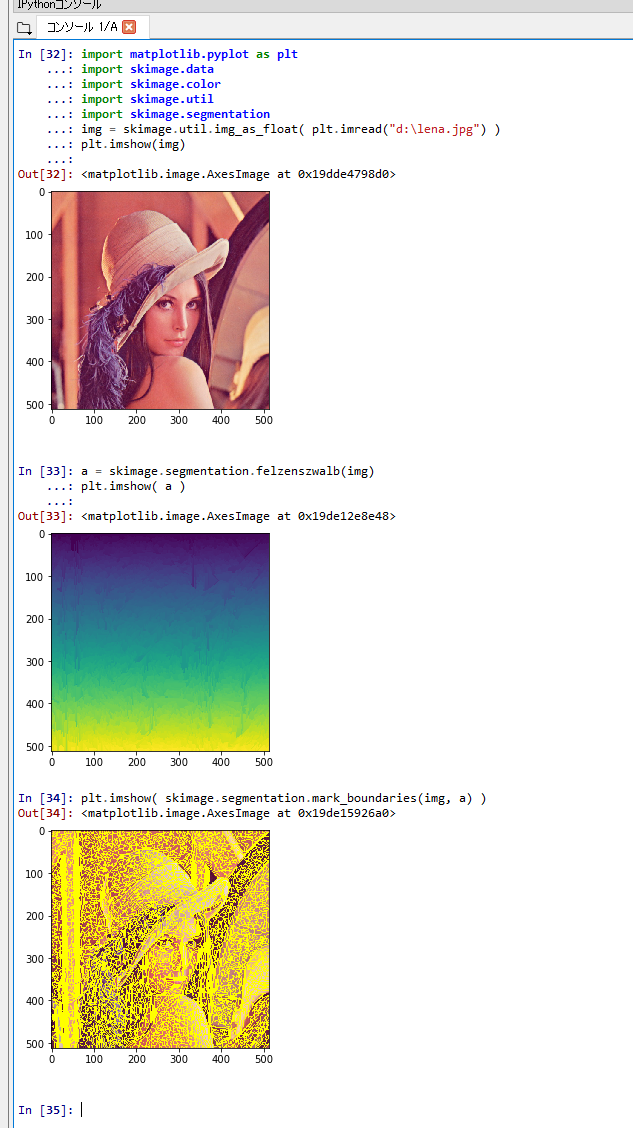
felzenszwalb
felzenszwalb を行う.
Python プログラムを実行する.Matplotlib を使うので,Jupyter QtConsole や Jupyter ノートブック (Jupyter Notebook) の利用が便利である.
%matplotlib inline
import matplotlib.pyplot as plt
import warnings
warnings.filterwarnings('ignore')   # Suppress Matplotlib warnings
import skimage.data
import skimage.color
import skimage.filters
import skimage.util
import skimage.segmentation
img = skimage.util.img_as_float( plt.imread("d:\lena_std.jpg") )
plt.imshow(img)

a = skimage.segmentation.felzenszwalb(img)
plt.imshow( a )

plt.imshow( skimage.segmentation.mark_boundaries(img, a) )
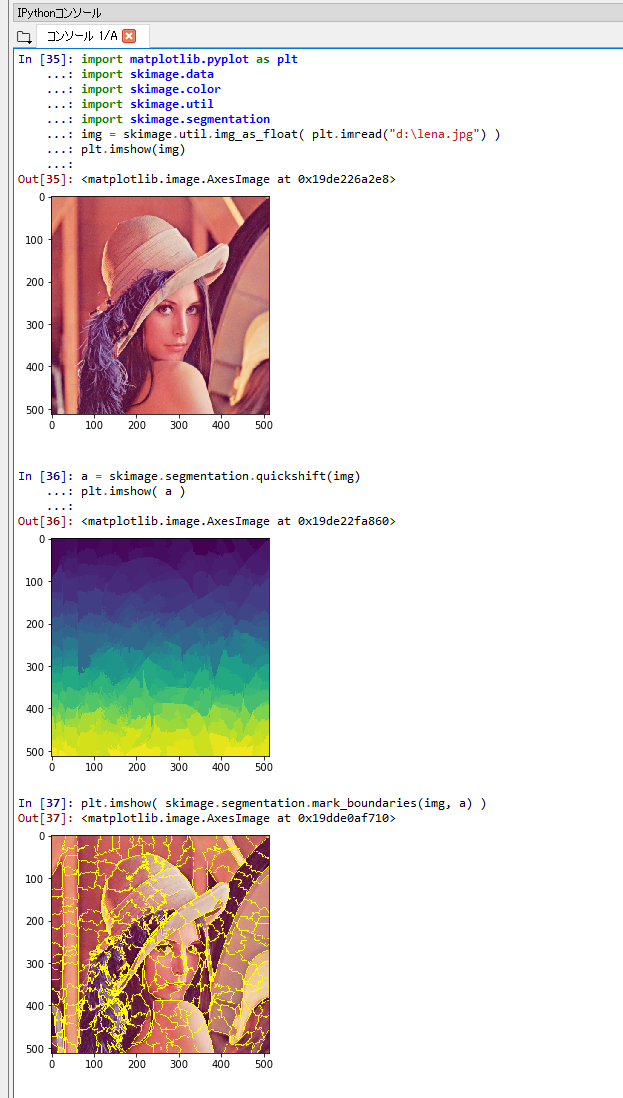
quickshift
quickshift を行う.
Python プログラムを実行する.Matplotlib を使うので,Jupyter QtConsole や Jupyter ノートブック (Jupyter Notebook) の利用が便利である.
%matplotlib inline
import matplotlib.pyplot as plt
import warnings
warnings.filterwarnings('ignore')   # Suppress Matplotlib warnings
import skimage.data
import skimage.color
import skimage.filters
import skimage.util
import skimage.segmentation
img = skimage.util.img_as_float( plt.imread("d:\lena_std.jpg") )
plt.imshow(img)

a = skimage.segmentation.quickshift(img)
plt.imshow( a )

plt.imshow( skimage.segmentation.mark_boundaries(img, a) )
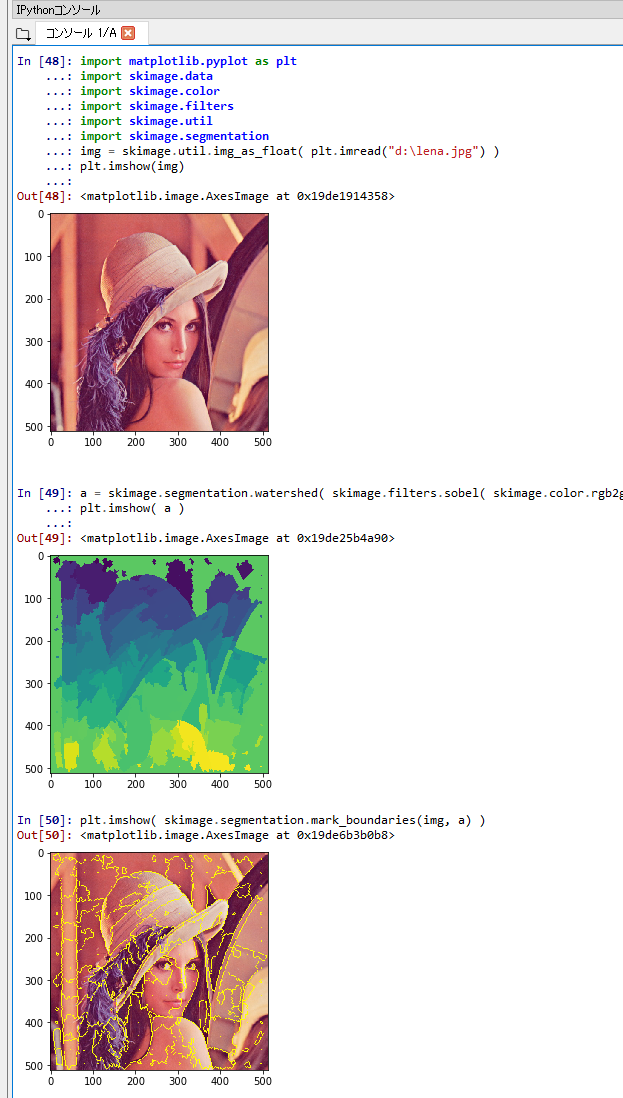
watershed
watershed を行う.
Python プログラムを実行する.Matplotlib を使うので,Jupyter QtConsole や Jupyter ノートブック (Jupyter Notebook) の利用が便利である.
%matplotlib inline
import matplotlib.pyplot as plt
import warnings
warnings.filterwarnings('ignore')   # Suppress Matplotlib warnings
import skimage.data
import skimage.color
import skimage.filters
import skimage.util
import skimage.segmentation
img = skimage.util.img_as_float( plt.imread("d:\lena_std.jpg") )
plt.imshow(img)

a = skimage.segmentation.watershed( skimage.filters.sobel( skimage.color.rgb2gray( img ) ), markers=250 )
plt.imshow( a )

plt.imshow( skimage.segmentation.mark_boundaries(img, a) )