SLIC (scikit-image に含まれる)のインストールと動作確認(スーパーピクセル)(Python を使用)(Windows 上)
scikit に実装されているスーパーピクセルを試してみる
【関連する外部ページ】
スーパーピクセルに関する参考記事: http://scikit-image.org/docs/dev/auto_examples/segmentation/plot_segmentations.html
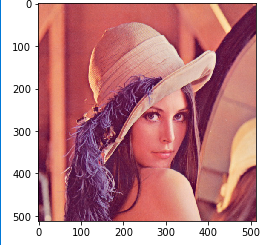
元画像
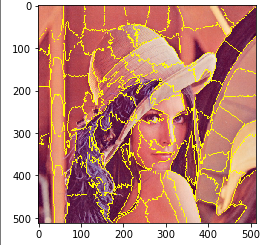
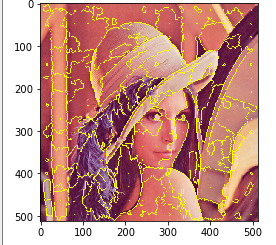
SLIC
felzenszwalb
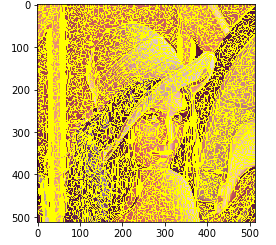
quickshift
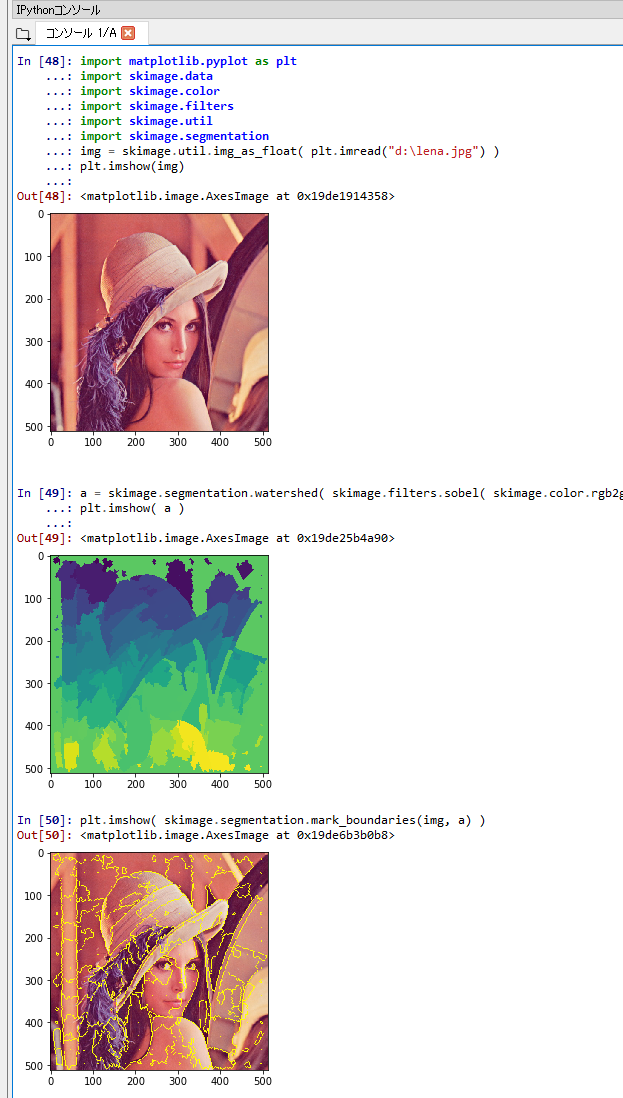
watershed
前準備
Python 3.12 のインストール
インストール済みの場合は実行不要。
管理者権限でコマンドプロンプトを起動(手順:Windowsキーまたはスタートメニュー > cmd と入力 > 右クリック > 「管理者として実行」)し、以下を実行する。管理者権限は、wingetの--scope machineオプションでシステム全体にソフトウェアをインストールするために必要である。
REM Python 3.12 をシステム領域にインストール
winget install --scope machine --id Python.Python.3.12 -e --silent --accept-source-agreements --accept-package-agreements
REM Python のパス設定
set "PYTHON_PATH=C:\Program Files\Python312"
set "PYTHON_SCRIPTS_PATH=C:\Program Files\Python312\Scripts"
if exist "%PYTHON_PATH%" setx PYTHON_PATH "%PYTHON_PATH%" /M >nul
if exist "%PYTHON_SCRIPTS_PATH%" setx PYTHON_SCRIPTS_PATH "%PYTHON_SCRIPTS_PATH%" /M >nul
for /f "tokens=2*" %a in ('reg query "HKLM\SYSTEM\CurrentControlSet\Control\Session Manager\Environment" /v Path') do set "SYSTEM_PATH=%b"
echo "%SYSTEM_PATH%" | find /i "%PYTHON_PATH%" >nul
if errorlevel 1 setx PATH "%PYTHON_PATH%;%PYTHON_SCRIPTS_PATH%;%SYSTEM_PATH%" /M >nul【関連する外部ページ】
Python の公式ページ: https://www.python.org/
AI エディタ Windsurf のインストール
Pythonプログラムの編集・実行には、AI エディタの利用を推奨する。ここでは,Windsurfのインストールを説明する。
管理者権限でコマンドプロンプトを起動(手順:Windowsキーまたはスタートメニュー > cmd と入力 > 右クリック > 「管理者として実行」)し、以下を実行して、Windsurfをシステム全体にインストールする。管理者権限は、wingetの--scope machineオプションでシステム全体にソフトウェアをインストールするために必要となる。
winget install --scope machine --id Codeium.Windsurf -e --silent --accept-source-agreements --accept-package-agreements【関連する外部ページ】
Windsurf の公式ページ: https://windsurf.com/
SLIC (scikit-image) のインストール
-
Windows で,管理者権限でコマンドプロンプトを起動(手順:Windowsキーまたはスタートメニュー >
cmdと入力 > 右クリック > 「管理者として実行」)。次のコマンドを実行する.
python -m pip install -U scikit-image matplotlib
スーパーピクセルの実行(scikit-image の SLIC,Python を使用)
SLIC
SLIC を行う Python プログラムを実行してみる.
- Python プログラムを実行する..Matplotlib を使うので,Jupyter QtConsole や Jupyter ノートブック (Jupyter Notebook) の利用が便利である.
- Python プログラムを実行する
%matplotlib inline
import matplotlib.pyplot as plt
import warnings
warnings.filterwarnings('ignore')   # Suppress Matplotlib warnings
import skimage.data
import skimage.color
import skimage.filters
import skimage.util
import skimage.segmentation
img = skimage.util.img_as_float( plt.imread("d:\lena_std.jpg") )
plt.imshow(img)

a = skimage.segmentation.slic(img)
plt.imshow( a )

plt.imshow( skimage.segmentation.mark_boundaries(img, a) )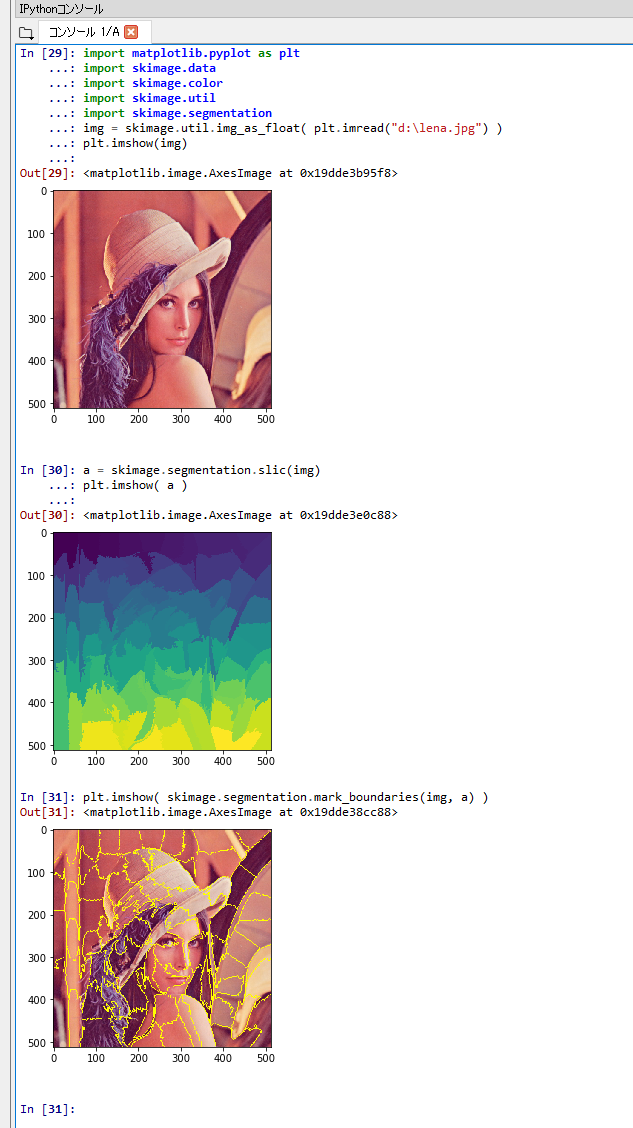
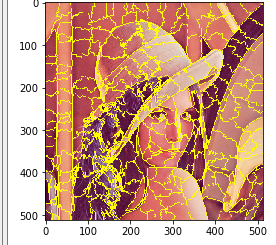
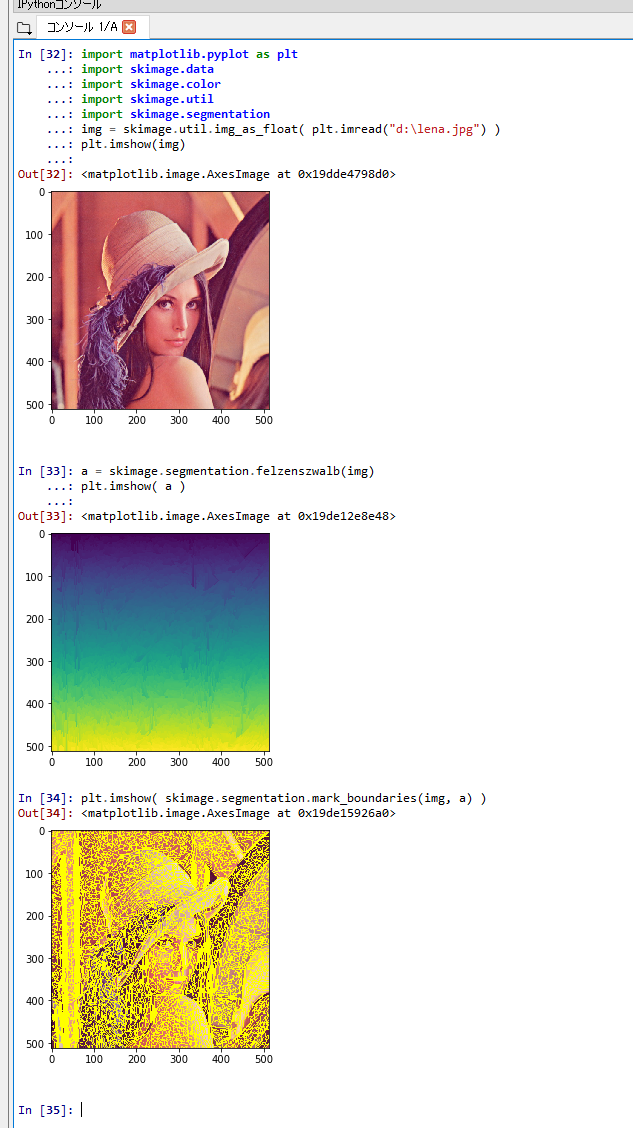
felzenszwalb
felzenszwalb を行う.
Python プログラムを実行する.Matplotlib を使うので,Jupyter QtConsole や Jupyter ノートブック (Jupyter Notebook) の利用が便利である.
%matplotlib inline
import matplotlib.pyplot as plt
import warnings
warnings.filterwarnings('ignore')   # Suppress Matplotlib warnings
import skimage.data
import skimage.color
import skimage.filters
import skimage.util
import skimage.segmentation
img = skimage.util.img_as_float( plt.imread("d:\lena_std.jpg") )
plt.imshow(img)

a = skimage.segmentation.felzenszwalb(img)
plt.imshow( a )

plt.imshow( skimage.segmentation.mark_boundaries(img, a) )
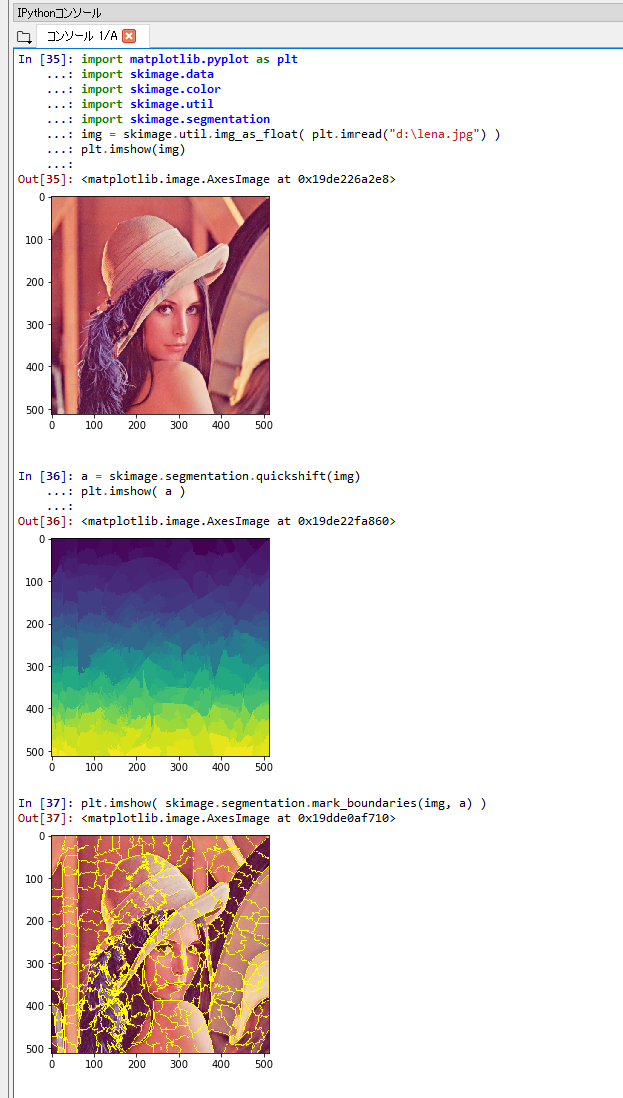
quickshift
quickshift を行う.
Python プログラムを実行する.Matplotlib を使うので,Jupyter QtConsole や Jupyter ノートブック (Jupyter Notebook) の利用が便利である.
%matplotlib inline
import matplotlib.pyplot as plt
import warnings
warnings.filterwarnings('ignore')   # Suppress Matplotlib warnings
import skimage.data
import skimage.color
import skimage.filters
import skimage.util
import skimage.segmentation
img = skimage.util.img_as_float( plt.imread("d:\lena_std.jpg") )
plt.imshow(img)

a = skimage.segmentation.quickshift(img)
plt.imshow( a )

plt.imshow( skimage.segmentation.mark_boundaries(img, a) )
watershed
watershed を行う.
Python プログラムを実行する.Matplotlib を使うので,Jupyter QtConsole や Jupyter ノートブック (Jupyter Notebook) の利用が便利である.
%matplotlib inline
import matplotlib.pyplot as plt
import warnings
warnings.filterwarnings('ignore')   # Suppress Matplotlib warnings
import skimage.data
import skimage.color
import skimage.filters
import skimage.util
import skimage.segmentation
img = skimage.util.img_as_float( plt.imread("d:\lena_std.jpg") )
plt.imshow(img)

a = skimage.segmentation.watershed( skimage.filters.sobel( skimage.color.rgb2gray( img ) ), markers=250 )
plt.imshow( a )

plt.imshow( skimage.segmentation.mark_boundaries(img, a) )