librosa のインストールと動作確認(音声処理)(Python を使用)(Windows 上)
librosa は, 音声,音楽の機能をもった Python のパッケージである. 主な機能としては,音源分離(music source separation),スペクトログラム, 音声ファイルの読み込み,テンポ(tempo)の推定がある.
【目次】
【文献】
McFee, Brian, Colin Raffel, Dawen Liang, Daniel PW Ellis, Matt McVicar, Eric Battenberg, and Oriol Nieto. “librosa: Audio and music signal analysis in python.” In Proceedings of the 14th python in science conference, pp. 18-25. 2015.
【関連する外部ページ】
- 公式のドキュメントのページ: https://librosa.org/doc/latest/index.html
- 公式の GitHub のページ: https://github.com/librosa/librosa
前準備
Python 3.12,Git のインストール(Windows 上)
Pythonは,プログラミング言語の1つ. Gitは,分散型のバージョン管理システム.
【手順】
- Windows で,管理者権限でコマンドプロンプトを起動(手順:Windowsキーまたはスタートメニュー >
cmdと入力 > 右クリック > 「管理者として実行」)。次のコマンドを実行
次のコマンドは,Python ランチャーとPython 3.12とGitをインストールし,Gitにパスを通すものである.
次のコマンドでインストールされるGitは 「git for Windows」と呼ばれるものであり, Git,MinGW などから構成されている.
reg add "HKLM\SYSTEM\CurrentControlSet\Control\FileSystem" /v LongPathsEnabled /t REG_DWORD /d 1 /f
REM Python, Git をシステム領域にインストール
winget install --scope machine --id Python.Python.3.12 --id Python.Launcher --id Git.Git -e --silent
REM Python のパス
set "INSTALL_PATH=C:\Program Files\Python312"
echo "%PATH%" | find /i "%INSTALL_PATH%" >nul
if errorlevel 1 setx PATH "%PATH%;%INSTALL_PATH%" /M >nul
echo "%PATH%" | find /i "%INSTALL_PATH%\Scripts" >nul
if errorlevel 1 setx PATH "%PATH%;%INSTALL_PATH%\Scripts" /M >nul
REM Git のパス
set "NEW_PATH=C:\Program Files\Git\cmd"
if exist "%NEW_PATH%" echo "%PATH%" | find /i "%NEW_PATH%" >nul
if exist "%NEW_PATH%" if errorlevel 1 setx PATH "%PATH%;%NEW_PATH%" /M >nul
【関連する外部ページ】
- Python の公式ページ: https://www.python.org/
- Git の公式ページ: https://git-scm.com/
【サイト内の関連ページ】
【関連項目】 Python, Git バージョン管理システム, Git の利用
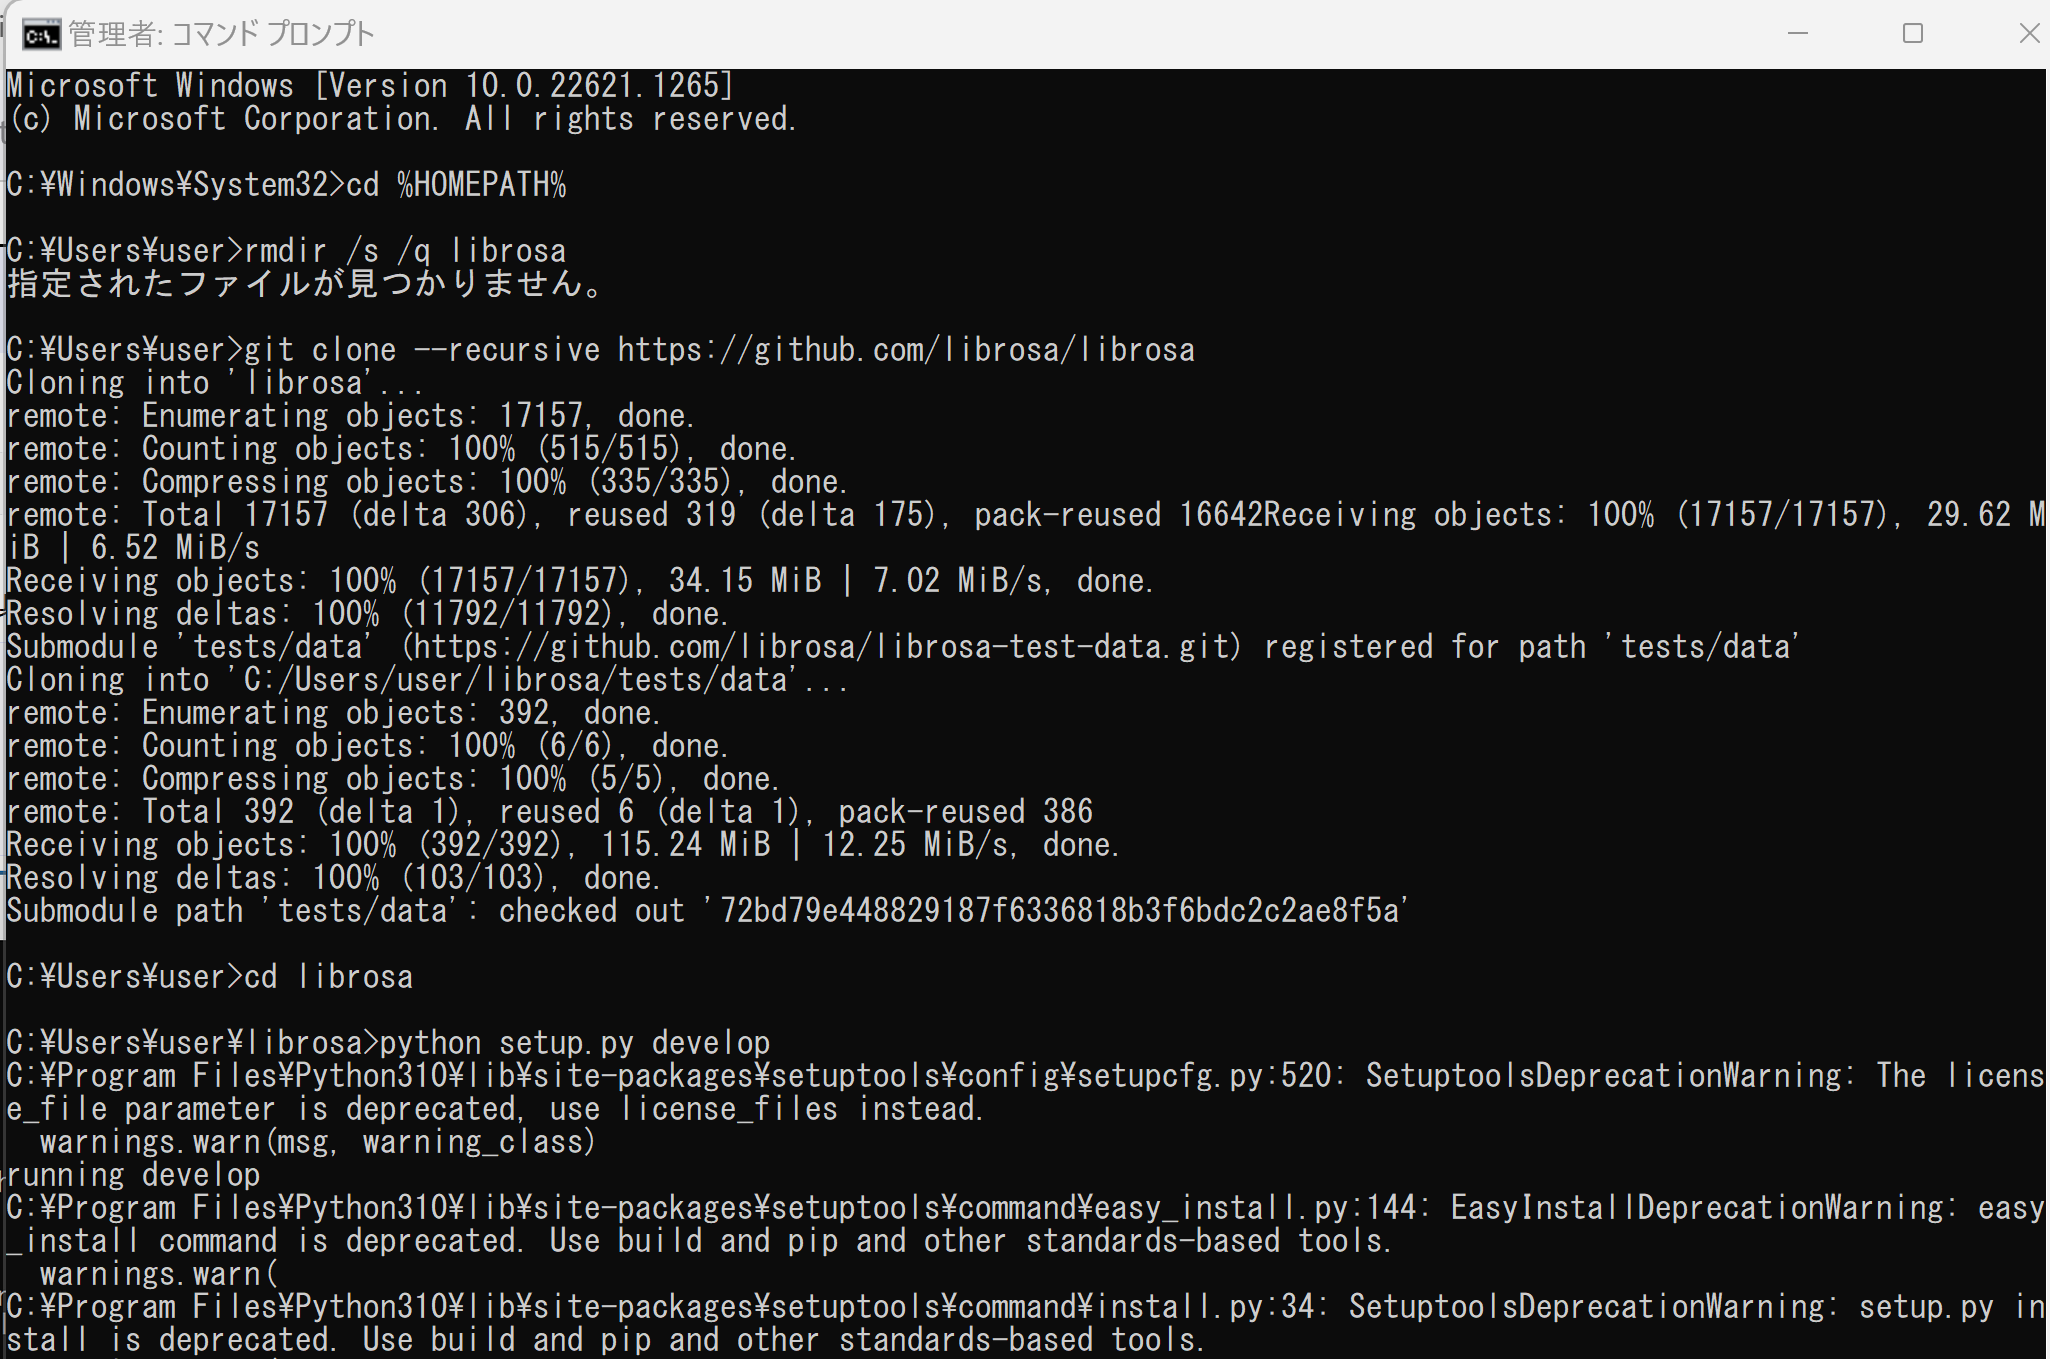
librosa のインストール(Python,pip を使用)(Windows 上)
- Windows で,管理者権限でコマンドプロンプトを起動(手順:Windowsキーまたはスタートメニュー >
cmdと入力 > 右クリック > 「管理者として実行」)。 - インストール
試してみたが,「pip install librosa」でインストールするよりも,下の手順の方がトラブルが少なそう.
cd /d c:%HOMEPATH%
rmdir /s /q librosa
git clone --recursive https://github.com/librosa/librosa
cd librosa
python setup.py develop
(以下省略)
動作確認のため動かしてみる(Windows 上)
librosa の公式チュートリアル https://librosa.org/doc/latest/tutorial.html に記載のプログラムを実行してみる.
- 次の Python プログラムを実行する
このプログラムはビートの推定を行う.
# Beat tracking example
import librosa

# 1. Get the file path to an included audio example
filename = librosa.example('nutcracker')

# 2. Load the audio as a waveform `y`
#    Store the sampling rate as `sr`
y, sr = librosa.load(filename)

# 3. Run the default beat tracker
tempo, beat_frames = librosa.beat.beat_track(y=y, sr=sr)
print('Estimated tempo: {:.2f} beats per minute'.format(tempo))

# 4. Convert the frame indices of beat events into timestamps
beat_times = librosa.frames_to_time(beat_frames, sr=sr)
print(beat_times)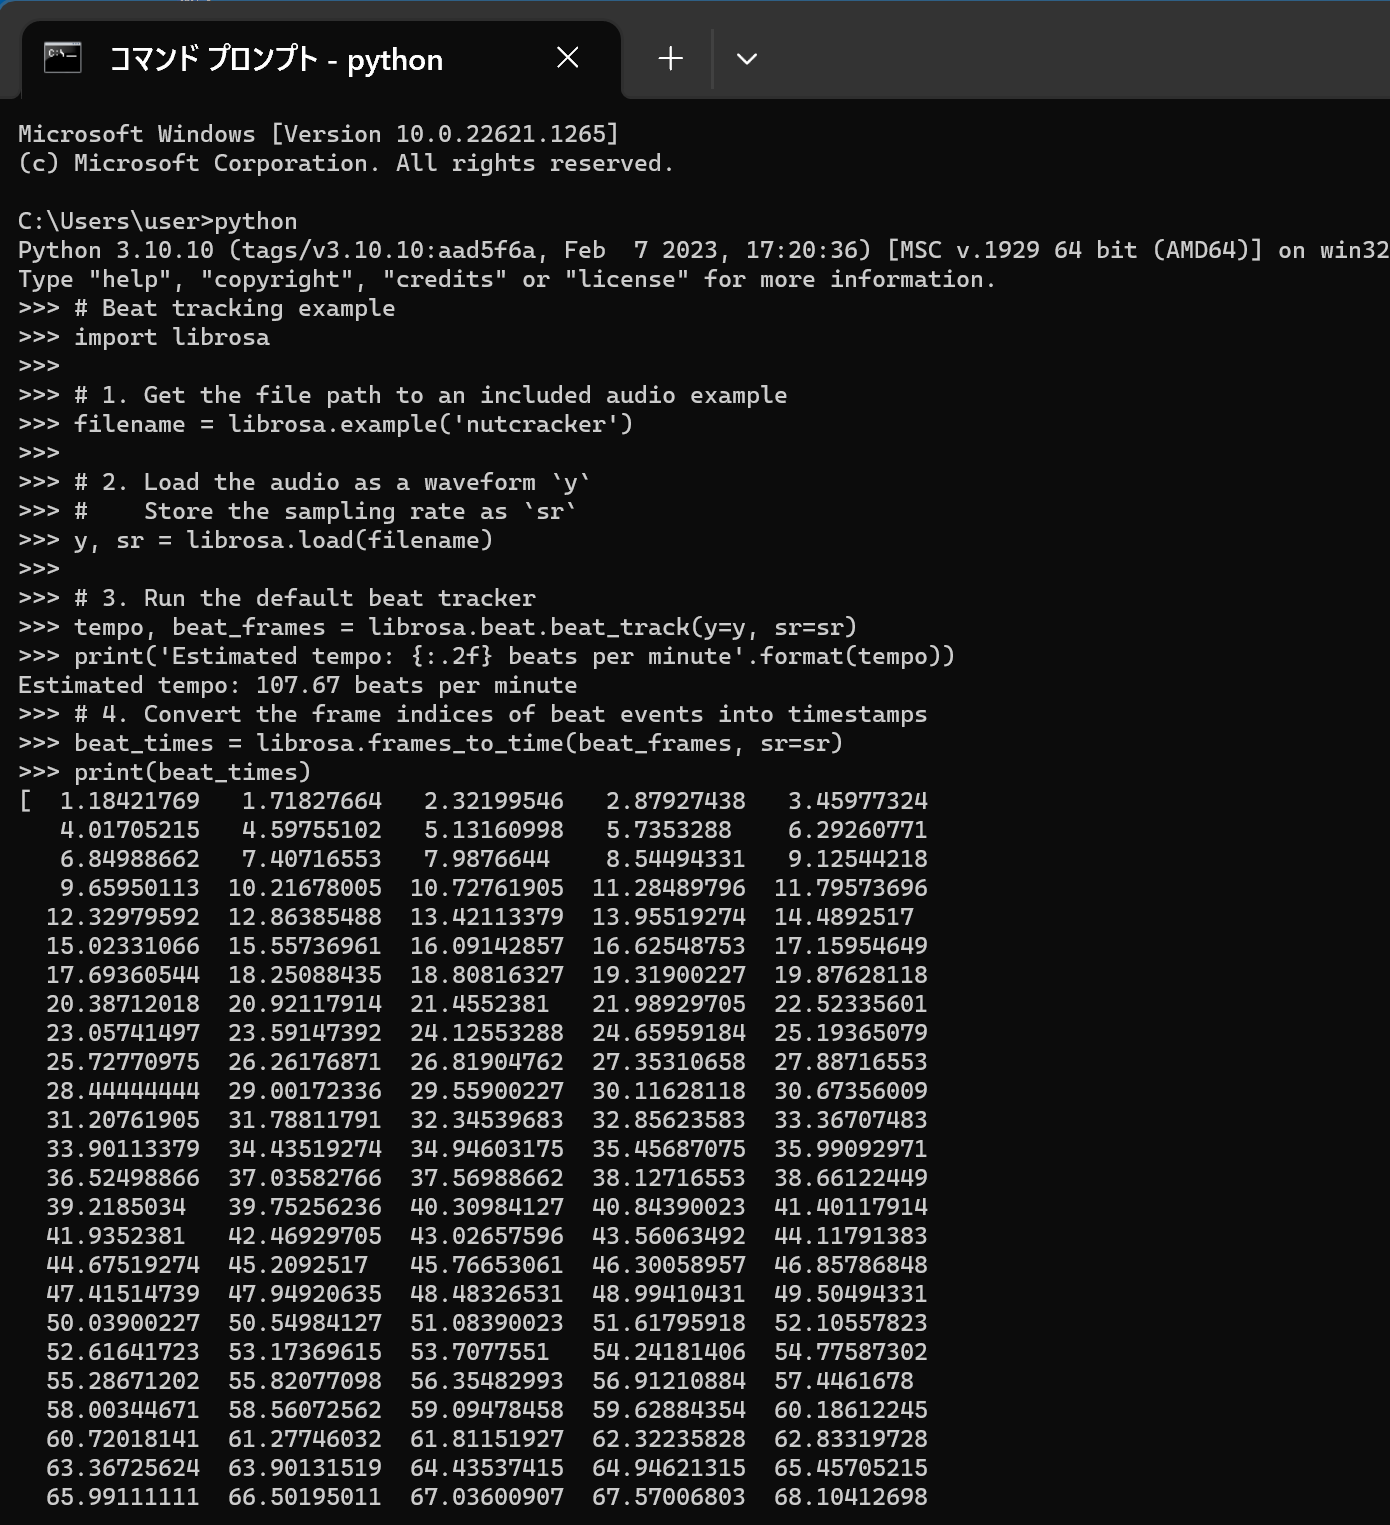
- 次の Python プログラムを実行する
このプログラムは beat feature の算出を行う.
# Feature extraction example
import numpy as np
import librosa

# Load the example clip
y, sr = librosa.load(librosa.ex('nutcracker'))

# Set the hop length; at 22050 Hz, 512 samples ~= 23ms
hop_length = 512

# Separate harmonics and percussives into two waveforms
y_harmonic, y_percussive = librosa.effects.hpss(y)

# Beat track on the percussive signal
tempo, beat_frames = librosa.beat.beat_track(y=y_percussive, sr=sr)

# Compute MFCC features from the raw signal
mfcc = librosa.feature.mfcc(y=y, sr=sr, hop_length=hop_length, n_mfcc=13)

# And the first-order differences (delta features)
mfcc_delta = librosa.feature.delta(mfcc)

# Stack and synchronize between beat events
# This time, we'll use the mean value (default) instead of median
beat_mfcc_delta = librosa.util.sync(np.vstack([mfcc, mfcc_delta]), beat_frames)

# Compute chroma features from the harmonic signal
chromagram = librosa.feature.chroma_cqt(y=y_harmonic, sr=sr)

# Aggregate chroma features between beat events
# We'll use the median value of each feature between beat frames
beat_chroma = librosa.util.sync(chromagram, beat_frames, aggregate=np.median)

# Finally, stack all beat-synchronous features together
beat_features = np.vstack([beat_chroma, beat_mfcc_delta])
print(beat_features)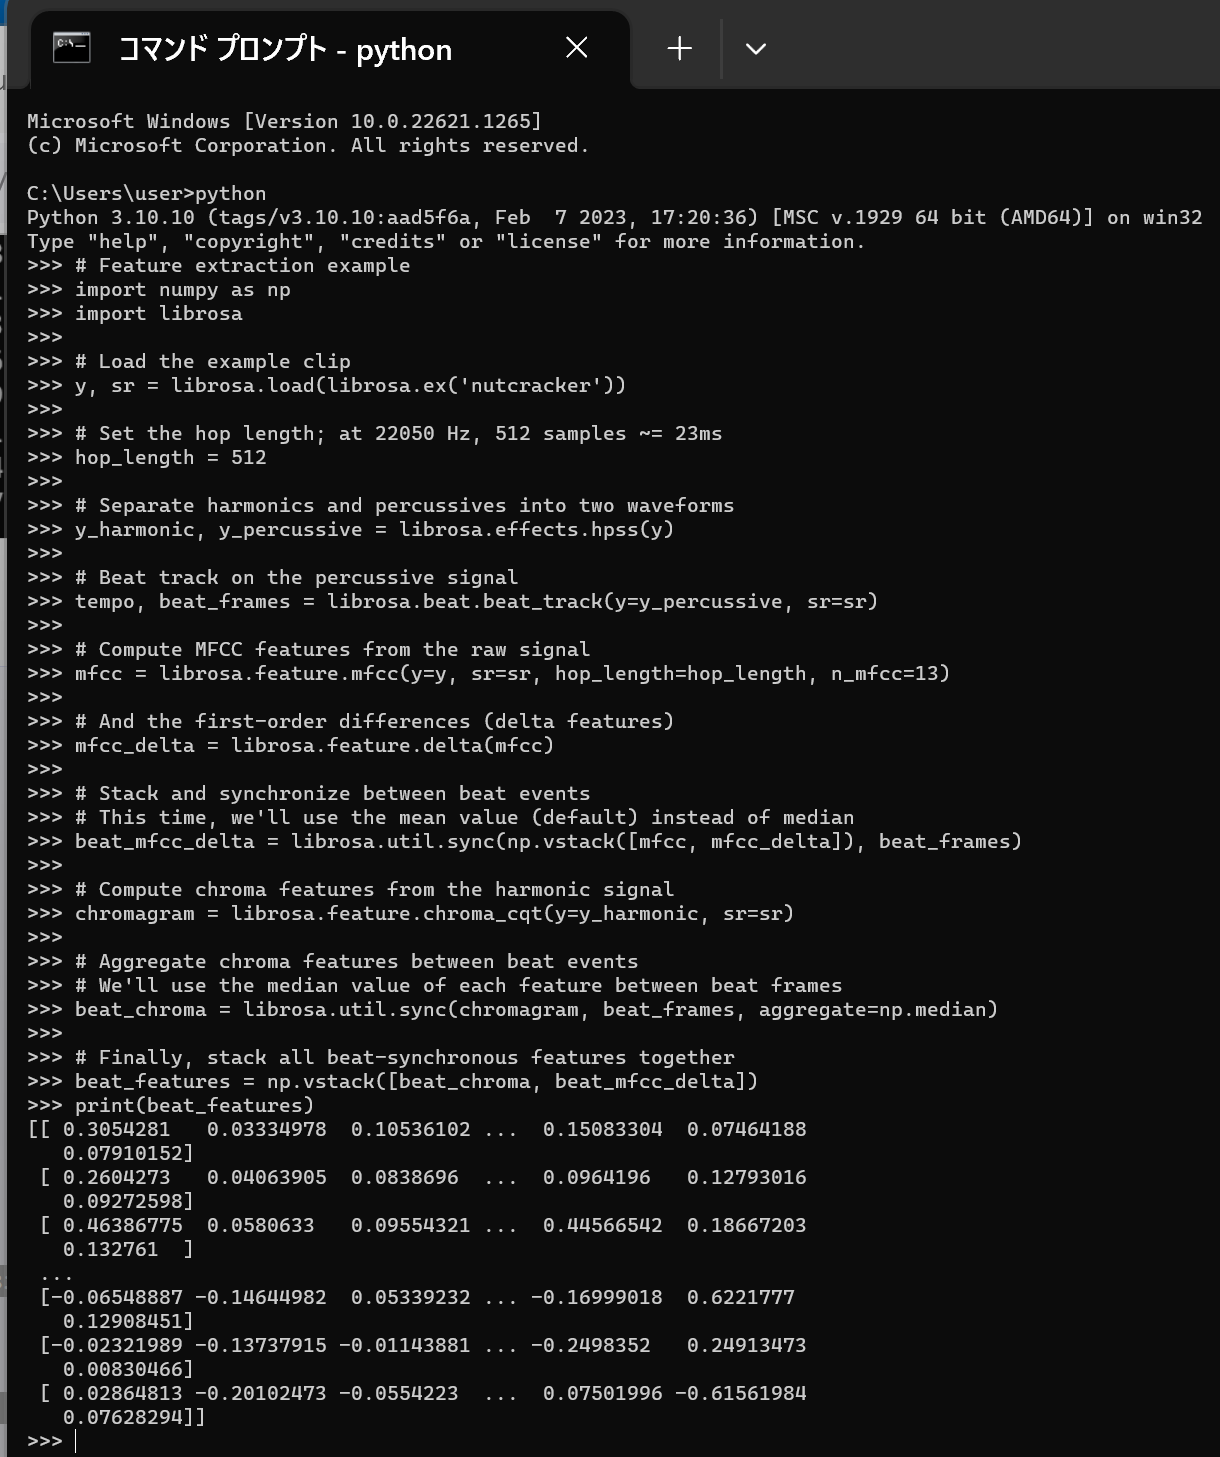
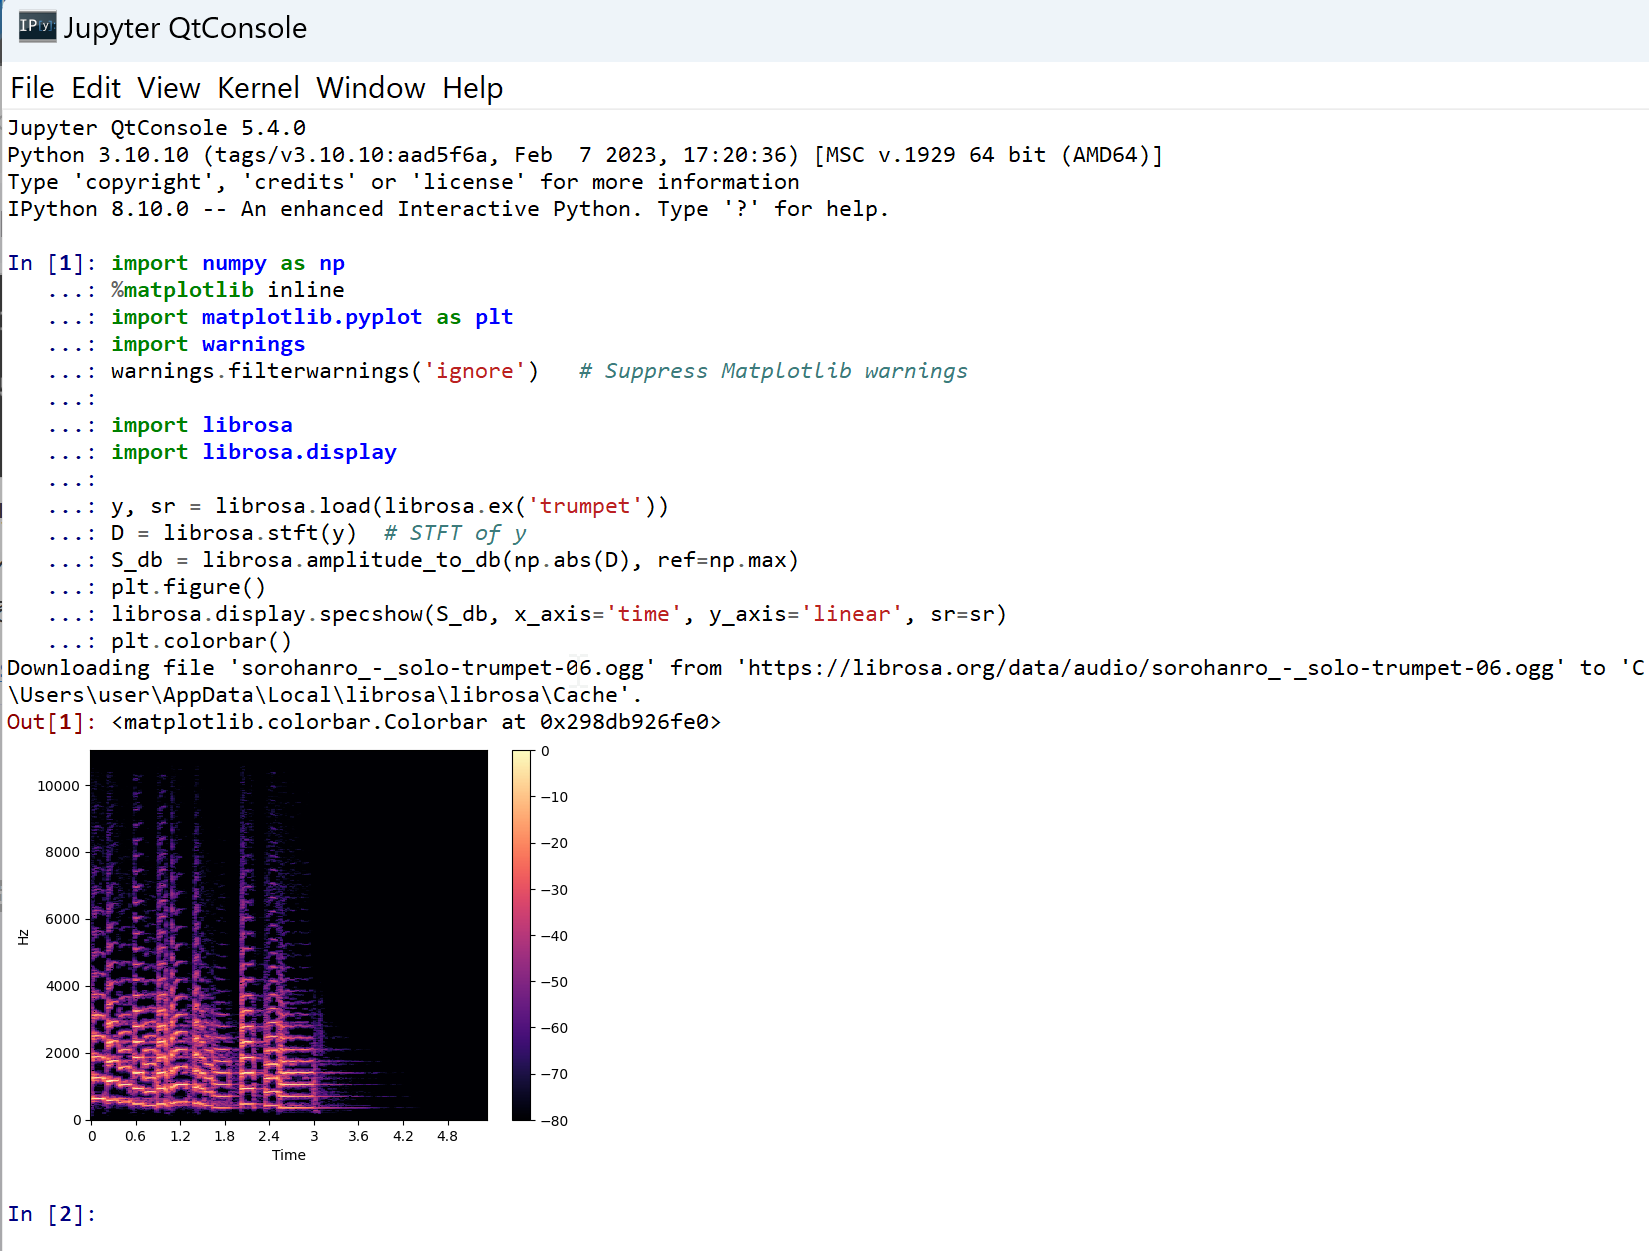
- 次の Python プログラムを実行する.Matplotlib を使うので,Jupyter QtConsole や Jupyter ノートブック (Jupyter Notebook) の利用が便利である.
次のプログラムは,librosa に付属の音声データである trumpet について,パワースペクトログラムを表示する. 次のプログラムでは,横軸は時間,縦軸は線形スケール(linear scale)で表された周波数である パワースペクトログラムを表示する. stft は short-time Fourier transform を行う. そして,その振幅により色をプロットする.
ここのプログラムのソースコードは, http://librosa.org/doc/main/auto_examples/plot_display.html#sphx-glr-auto-examples-plot-display-py のものを使用(ISC ライセンス).
import numpy as np
%matplotlib inline
import matplotlib.pyplot as plt
import warnings
warnings.filterwarnings('ignore')   # Suppress Matplotlib warnings

import librosa
import librosa.display

y, sr = librosa.load(librosa.ex('trumpet'))
D = librosa.stft(y)  # STFT of y
S_db = librosa.amplitude_to_db(np.abs(D), ref=np.max)
plt.figure()
librosa.display.specshow(S_db, x_axis='time', y_axis='linear', sr=sr)
plt.colorbar()