R システムで有向グラフ,無向グラフの描画(R システム,kinship2 を使用)
このページでは,
R で graphviz パッケージを用いて、有向グラフ,無向グラフの描画を行う.
【関連する外部ページ】
R システムの CRAN の URL: https://cran.r-project.org/
前準備
R システムのインストール
【関連する外部ページ】
R システムの CRAN の URL: https://cran.r-project.org/
graphviz のインストール
- Windows での graphviz のインストール: 別ページ »で説明
- Ubuntu での graphviz のインストール:
sudo apt -yV install graphviz libgraphviz-dev
Bioconductor の biocLite.R のインストール
R システムで,次のコマンドを実行し,インストールする. vignette で説明を表示している.
source("http://bioconductor.org/biocLite.R")
biocLite("Rgraphviz")
vignette("Rgraphviz")
biocLite.R だけでなく, Bioconductor を丸ごとインストールしたいときの手順
source("http://bioconductor.org/biocLite.R")
biocLite(groupName="all")
vignette("Rgraphviz")
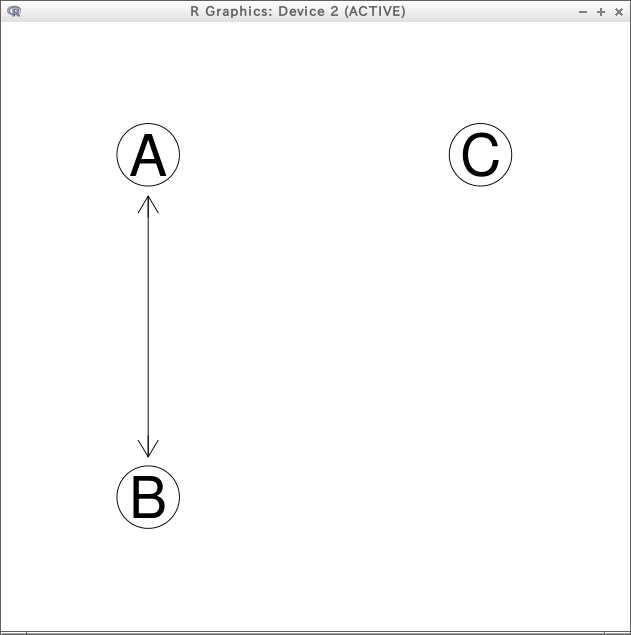
有向グラフと無向グラフの例
library("Rgraphviz")
r <- new("graphNEL", nodes=c("A", "B", "C"), edgemode="directed")
r <- addEdge(from="A", to="B", r, weights=1)
r <- addEdge(from="B", to="A", r, weights=1)
plot(r)
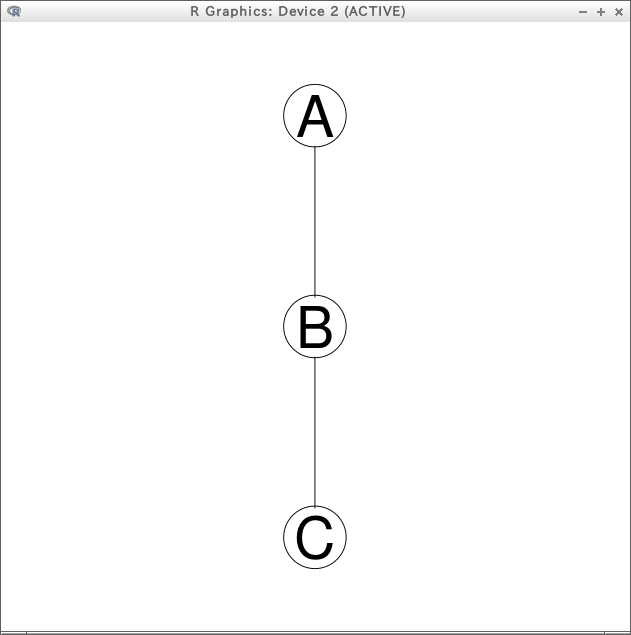
library("Rgraphviz")
r <- new("graphNEL", nodes=c("A", "B", "C"), edgemode="undirected")
r <- addEdge("A", "B", r, weights=1)
r <- addEdge("B", "C", r, weights=1)
plot(r)
属性の取得
- 前準備
library("Rgraphviz") r <- new("graphNEL", nodes=c("A", "B", "C"), edgemode="directed") r <- addEdge(from="A", to="B", r, weights=1) r <- addEdge(from="B", to="A", r, weights=1) - グラフの構造情報
- class() : オブジェクトのクラス
- str() : オブジェクトの構造
- <グラフ・オブジェクト名>@nodes, nodes() : 全ノードの取得
- <グラフ・オブジェクト名>@edgeL, edges() : 全エッジリストの取得
class(r)
str(r)
r@nodes
r@edgeL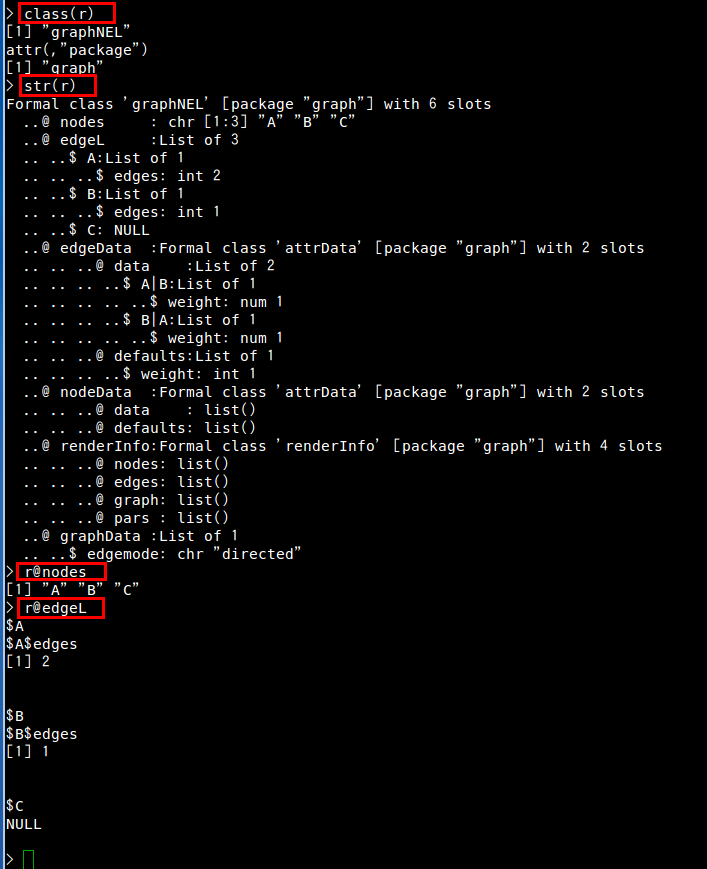
nodes(r)
edges(r)
- ノード数、エッジ数
- numNodes() : ノード数
- numEdges() : エッジ数
numNodes(r)
numEdges(r)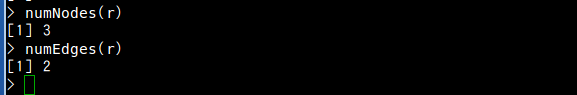
- ノード属性
- ノード属性として設定したい値を格納した変数 labels を次のように作る.グラフ r のノード数は 3 だったので,labels の長さは 3 にする.
labels <- c("hoge", "hoge2", "hoge3")
names(labels) <- nodes(r)
- 設定用のリストを作り,変数 labels の値を転記する
nattrs <- list()
nattrs$label <- labels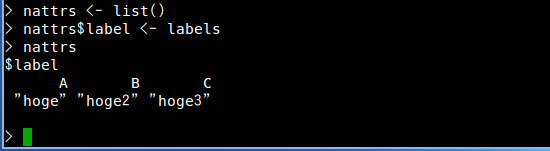
- plot() のパラメータに、描画したいグラフ r と設定用のリストを含める
plot(r, nodeAttrs=nattrs)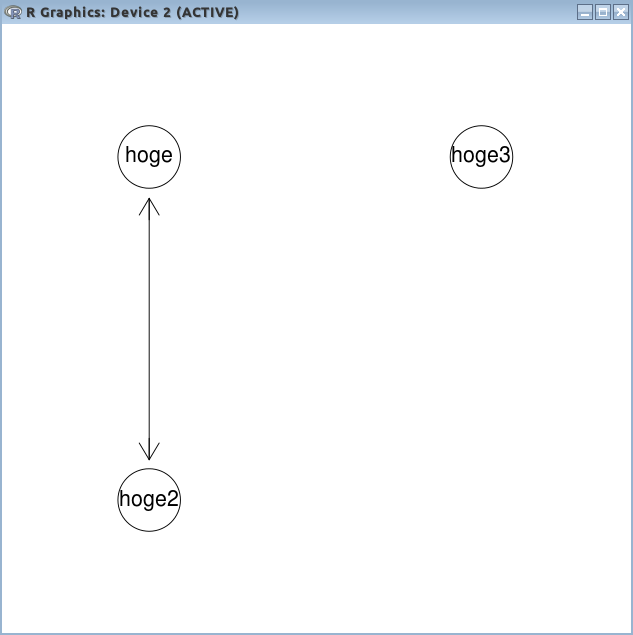
R
library("Rgraphviz")
r <- new("graphNEL", nodes=c("A", "B", "C", "D"), edgemode="directed")
r <- addEdge(from="A", to="B", r)
r <- addEdge(from="B", to="C", r)
r <- addEdge(from="C", to="D", r)
r <- addEdge(from="D", to="B", r)
pos <- character(numNodes(r))
pos <- c("1,1!", "5,5!", "1,8!", "9,3!")
names(pos) <- nodes(r)
pins <- character(numNodes(r))
pins[1:numNodes(r)] <- "TRUE"
names(pins) <- nodes(r)
nattrs <- list()
nattrs$pos <- pos
nattrs$pin <- pins
plot(r, "neato", nodeAttrs=nattrs)
plot( agopen(r, name="foo", nodeAttrs=nattrs, layout=FALSE, layoutType="fdp") )
- ノード属性として設定したい値を格納した変数 labels を次のように作る.グラフ r のノード数は 3 だったので,labels の長さは 3 にする.