Shiny を使ってみる(R システム,Shiny を使用)
このページでは,R システムでの shiny パッケージのインストール
と使用例を説明する.
【関連する外部ページ】
R システムの CRAN の URL: https://cran.r-project.org/
前準備
R システムのインストール
【関連する外部ページ】
R システムの CRAN の URL: https://cran.r-project.org/
shiny パッケージのインストール
R システムで,次のコマンドを実行し,インストールする. vignette で説明を表示.
このとき「Secure CRAN mirrors」のような,ミラーサイトの選択画面が出たときは「Japan」のものを選ぶ.
install.packages("shiny")
vignette("shiny")
この操作でインストールが行われる.
R システムのパッケージのインストールについては、
必要に応じて「Rでのパッケージのインストール」のページを参考にしてください.
Shiny を使ってみる
- プログラムを置くディレクトリを決める
このページでは、プログラムを置くディレクトリを「/var/tmp」とする. 以下の server.r, ui.r, run.r は同じディレクトリに置く.
- server.r を作成
library(shiny) shinyServer(function(input, output) { output$distPlot <- renderPlot({ # generate an rnorm distribution and plot it dist <- rnorm(n = input$n, mean = input$mean, sd = input$sd) hist(dist) }) }) - ui.r を作成
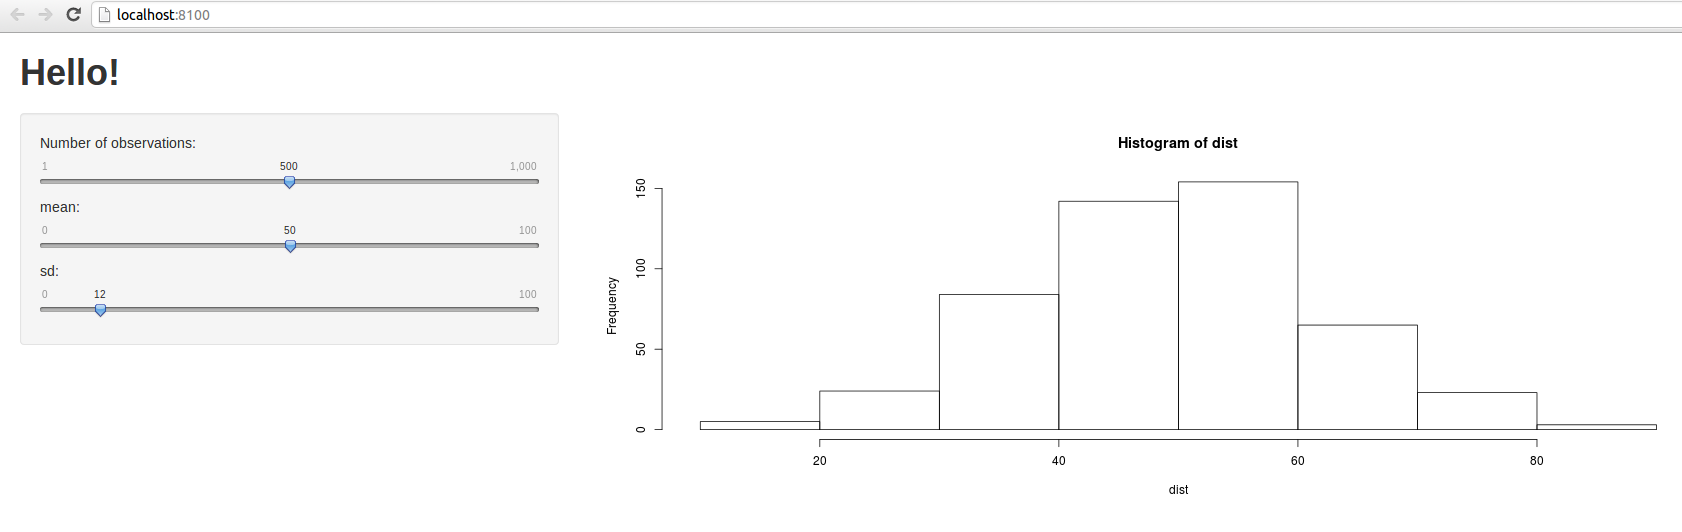
library(shiny) # Define UI for application that plots random distributions shinyUI(pageWithSidebar( # Application title headerPanel("Hello!"), # Sidebar with a slider input for number of observations sidebarPanel( sliderInput("n", "Number of observations:", min = 1, max = 1000, value = 500), sliderInput("mean", "mean:", min = 0, max = 100, value = 50), sliderInput("sd", "sd:", min = 0, max = 100, value = 1) ), # Show a plot of the generated distribution mainPanel( plotOutput("distPlot") ) )) - run.r を作成
「run.r」のファイル名 は自由に決めて良い
プログラムの中の「/var/tmp」には, プログラムファイルを置いたディレクトリを書く.
library(shiny)
runApp("/var/tmp")