librosa のインストールと動作確認(音声処理)(Python を使用)(Windows 上)
【目次】
【文献】
McFee, Brian, Colin Raffel, Dawen Liang, Daniel PW Ellis, Matt McVicar, Eric Battenberg, and Oriol Nieto. “librosa: Audio and music signal analysis in python.” In Proceedings of the 14th python in science conference, pp. 18-25. 2015.
【関連する外部ページ】
- 公式のドキュメントのページ: https://librosa.org/doc/latest/index.html
- 公式の GitHub のページ: https://github.com/librosa/librosa
前準備
Python 3.12 のインストール
Pythonのインストールを行い、Pythonのプログラムを実行する環境を整える。扱う環境は、Windows搭載パソコンである。金子研究室では、Python 3.12.10を推奨する。
[Windows での Python 3.12 のインストール手順を見るには、ここをクリック]
Windows での Python 3.12 のインストール
以下のいずれかの方法でPython 3.12をインストールする。Pythonがインストール済みの場合、この手順は不要である。
方法 1:winget によるインストール
【インストールコマンドの実行方法】
管理者権限でコマンドプロンプトを起動する(手順:Windowsキーまたはスタートメニュー → cmd と入力 → 右クリック → 「管理者として実行」)。そして、コマンド全体をコマンドプロンプトにコピー&ペーストする。
--scope machine を指定することで、システム全体(全ユーザー向け)にインストールされる。このオプションの実行には管理者権限が必要である。インストール完了後、コマンドプロンプトを再起動するとPATHが反映される。
REM Python 3.12 をシステム領域にインストール
winget install --id Python.Python.3.12 -e --scope machine --silent --accept-source-agreements --accept-package-agreements --override "/quiet InstallAllUsers=1 PrependPath=1 Include_test=0 Include_pip=1 Include_launcher=1 InstallLauncherAllUsers=1 TargetDir=\"C:\Program Files\Python312\""

REM Python と Scripts を PATH 先頭に追加
powershell -NoProfile -Command "$p='C:\Program Files\Python312'; $s=\"$p\Scripts\"; $c=[Environment]::GetEnvironmentVariable('Path','Machine'); if((Test-Path $p) -and (';'+$c+';' -notlike \"*;$p;*\") -and (';'+$c+';' -notlike \"*;$s;*\")){[Environment]::SetEnvironmentVariable('Path',\"$p;$s;$c\",'Machine')}"
方法 2:インストーラーによるインストール
- Python公式サイト(https://www.python.org/downloads/)にアクセスし、「Download Python 3.x.x」ボタンからWindows用インストーラーをダウンロードする。
- ダウンロードしたインストーラーを実行する。
- 初期画面の下部に表示される「Add python.exe to PATH」にチェックを入れてから「Customize installation」を選択する。このチェックを入れ忘れると、コマンドプロンプトから
pythonコマンドを実行できない。 - 「Install Python 3.xx for all users」にチェックを入れ、「Install」をクリックする。
インストールの確認
コマンドプロンプトで以下を実行する。
python --versionバージョン番号(例:Python 3.12.x)が表示されればインストール成功である。「'python' は、内部コマンドまたは外部コマンドとして認識されていません。」と表示される場合は、インストールが正常に完了していない。
Git のインストール
管理者権限のコマンドプロンプトで以下を実行する。管理者権限のコマンドプロンプトを起動するには、Windows キーまたはスタートメニューから「cmd」と入力し、表示された「コマンドプロンプト」を右クリックして「管理者として実行」を選択する。
REM Git をシステム領域にインストール
winget install --scope machine --id Git.Git -e --silent --disable-interactivity --force --accept-source-agreements --accept-package-agreements --override "/VERYSILENT /NORESTART /NOCANCEL /SP- /CLOSEAPPLICATIONS /RESTARTAPPLICATIONS /COMPONENTS=""icons,ext\reg\shellhere,assoc,assoc_sh"" /o:PathOption=Cmd /o:CRLFOption=CRLFCommitAsIs /o:BashTerminalOption=MinTTY /o:DefaultBranchOption=main /o:EditorOption=VIM /o:SSHOption=OpenSSH /o:UseCredentialManager=Enabled /o:PerformanceTweaksFSCache=Enabled /o:EnableSymlinks=Disabled /o:EnableFSMonitor=Disabled"
【関連する外部ページ】
- Git の公式ページ: https://git-scm.com/
librosa のインストール(Python,pip を使用)(Windows 上)
- 以下の手順を管理者権限のコマンドプロンプトで実行する
(手順:Windowsキーまたはスタートメニュー →
cmdと入力 → 右クリック → 「管理者として実行」)。 - インストール
試してみたが,「pip install librosa」でインストールするよりも,下の手順の方がトラブルが少なそう.
cd /d c:%HOMEPATH%
rmdir /s /q librosa
git clone --recursive https://github.com/librosa/librosa
cd librosa
python setup.py develop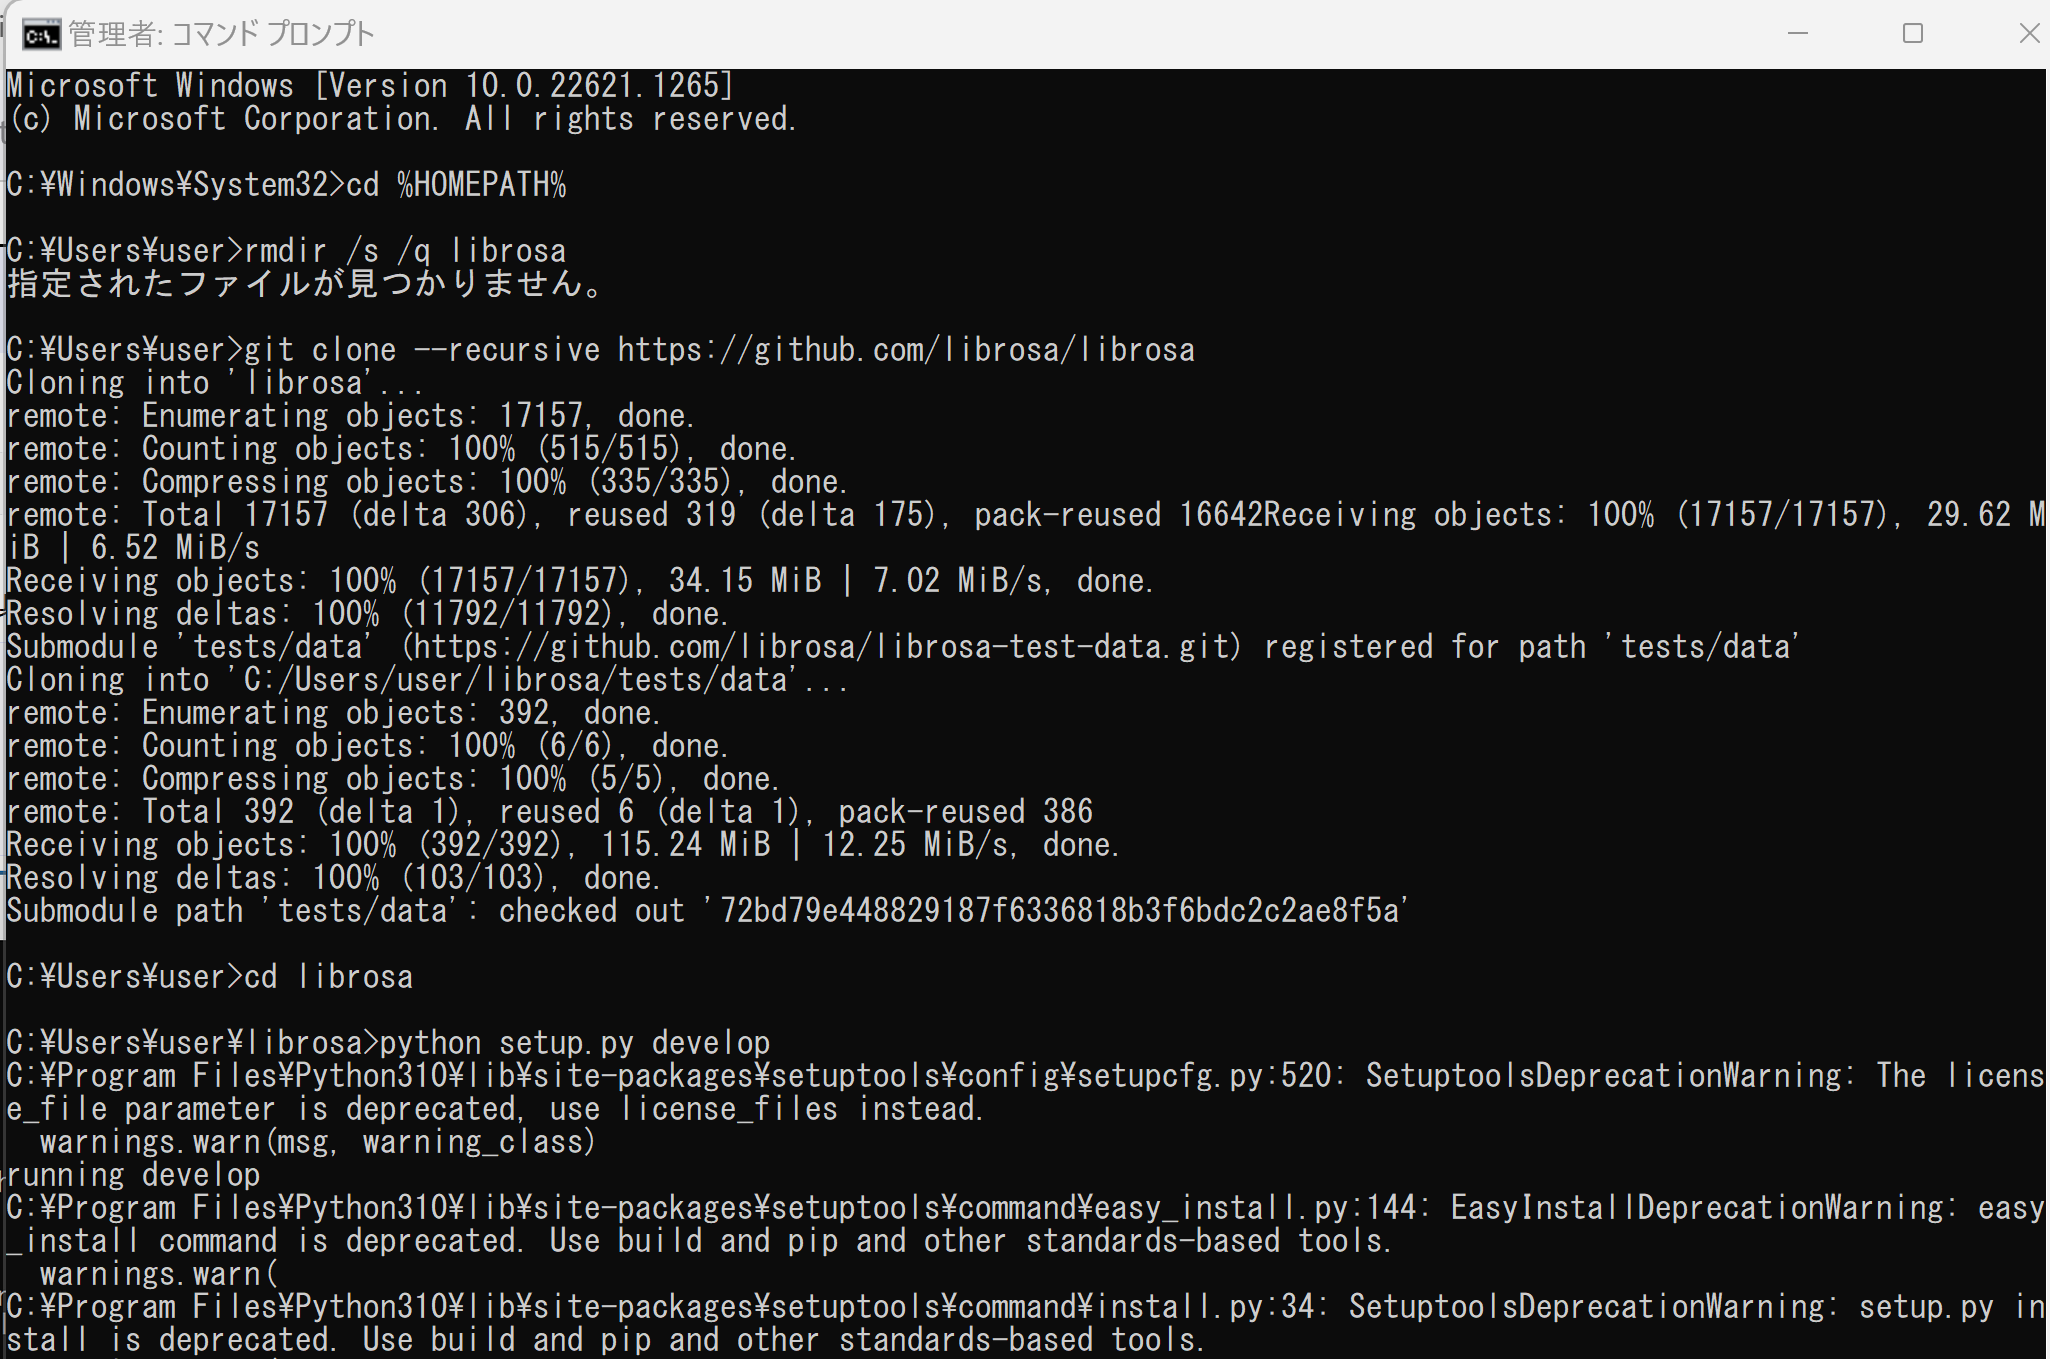
(以下省略)
動作確認のため動かしてみる(Windows 上)
librosa の公式チュートリアル https://librosa.org/doc/latest/tutorial.html に記載のプログラムを実行してみる.
- 次の Python プログラムを実行する
このプログラムはビートの推定を行う.
# Beat tracking example
import librosa

# 1. Get the file path to an included audio example
filename = librosa.example('nutcracker')

# 2. Load the audio as a waveform `y`
#    Store the sampling rate as `sr`
y, sr = librosa.load(filename)

# 3. Run the default beat tracker
tempo, beat_frames = librosa.beat.beat_track(y=y, sr=sr)
print('Estimated tempo: {:.2f} beats per minute'.format(tempo))

# 4. Convert the frame indices of beat events into timestamps
beat_times = librosa.frames_to_time(beat_frames, sr=sr)
print(beat_times)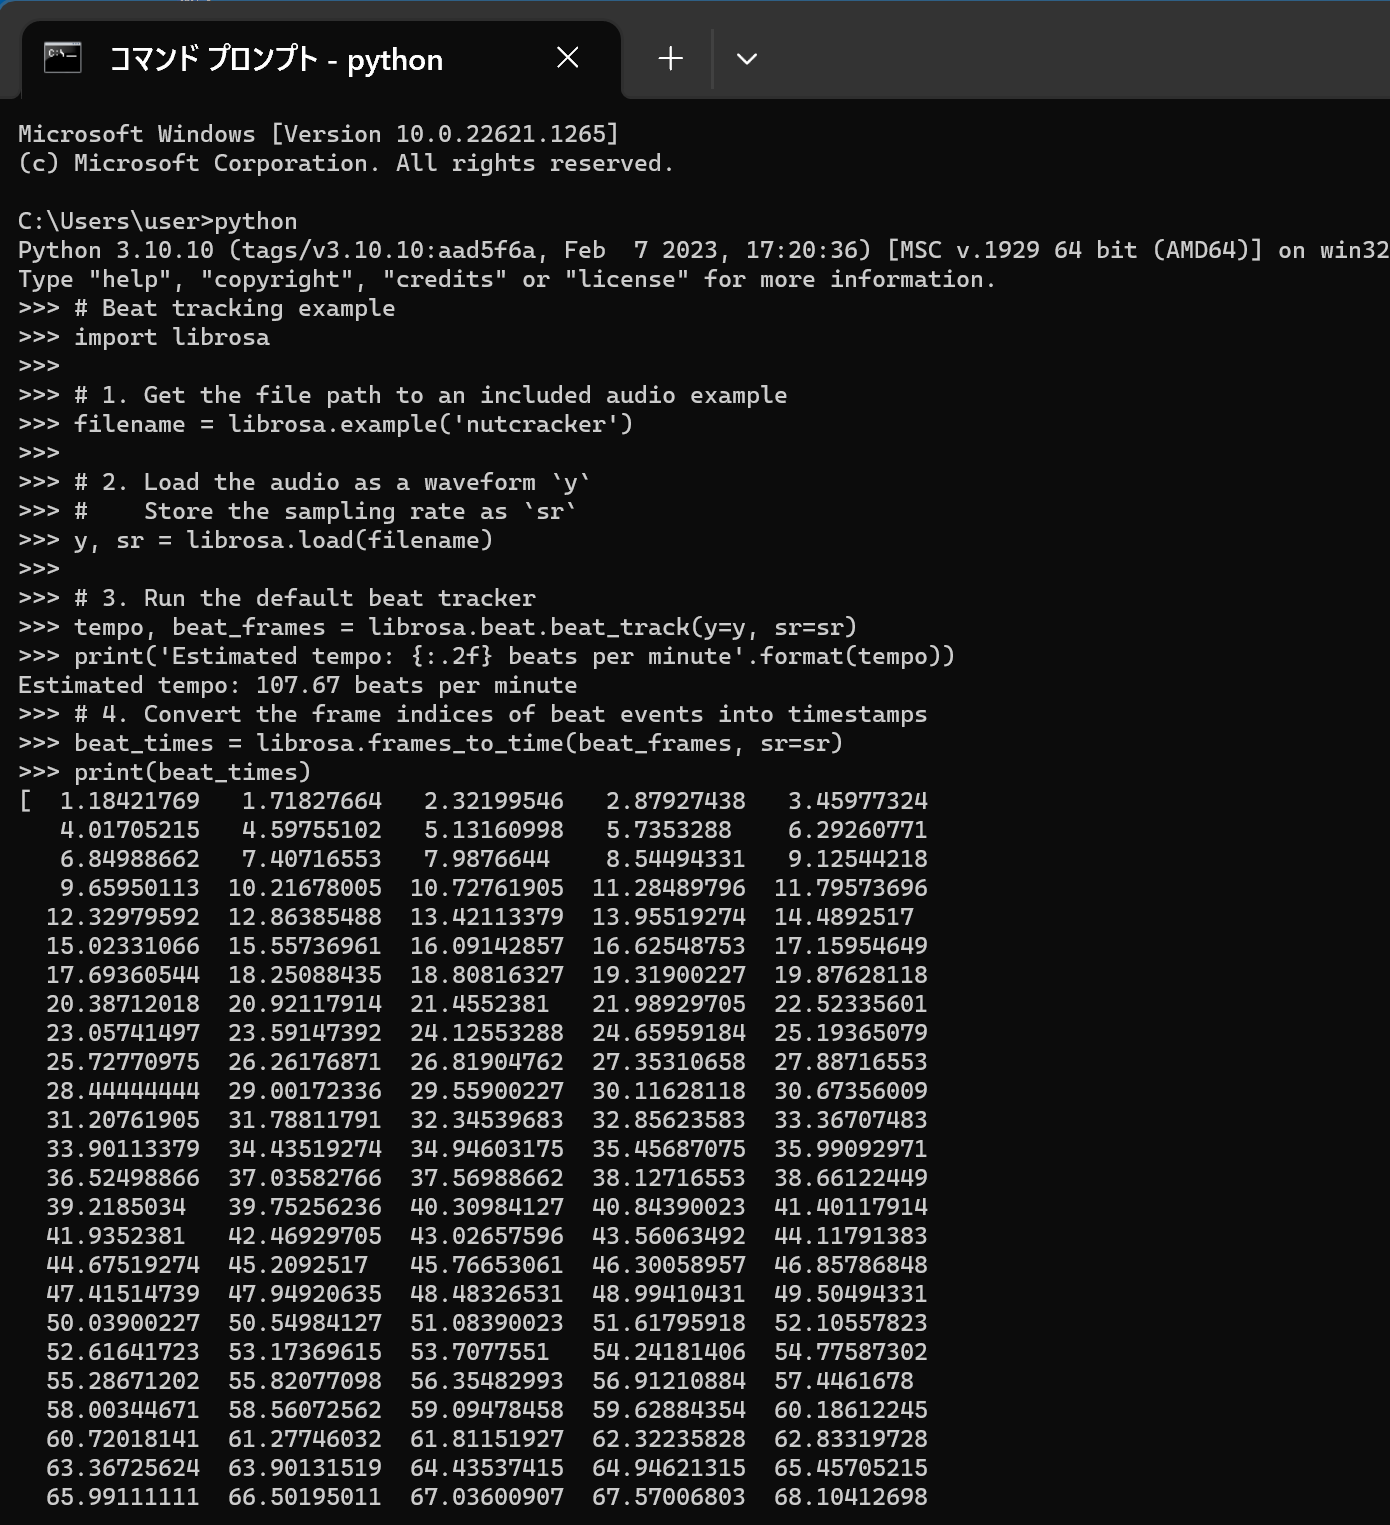
- 次の Python プログラムを実行する
このプログラムは beat feature の算出を行う.
# Feature extraction example
import numpy as np
import librosa

# Load the example clip
y, sr = librosa.load(librosa.ex('nutcracker'))

# Set the hop length; at 22050 Hz, 512 samples ~= 23ms
hop_length = 512

# Separate harmonics and percussives into two waveforms
y_harmonic, y_percussive = librosa.effects.hpss(y)

# Beat track on the percussive signal
tempo, beat_frames = librosa.beat.beat_track(y=y_percussive, sr=sr)

# Compute MFCC features from the raw signal
mfcc = librosa.feature.mfcc(y=y, sr=sr, hop_length=hop_length, n_mfcc=13)

# And the first-order differences (delta features)
mfcc_delta = librosa.feature.delta(mfcc)

# Stack and synchronize between beat events
# This time, we'll use the mean value (default) instead of median
beat_mfcc_delta = librosa.util.sync(np.vstack([mfcc, mfcc_delta]), beat_frames)

# Compute chroma features from the harmonic signal
chromagram = librosa.feature.chroma_cqt(y=y_harmonic, sr=sr)

# Aggregate chroma features between beat events
# We'll use the median value of each feature between beat frames
beat_chroma = librosa.util.sync(chromagram, beat_frames, aggregate=np.median)

# Finally, stack all beat-synchronous features together
beat_features = np.vstack([beat_chroma, beat_mfcc_delta])
print(beat_features)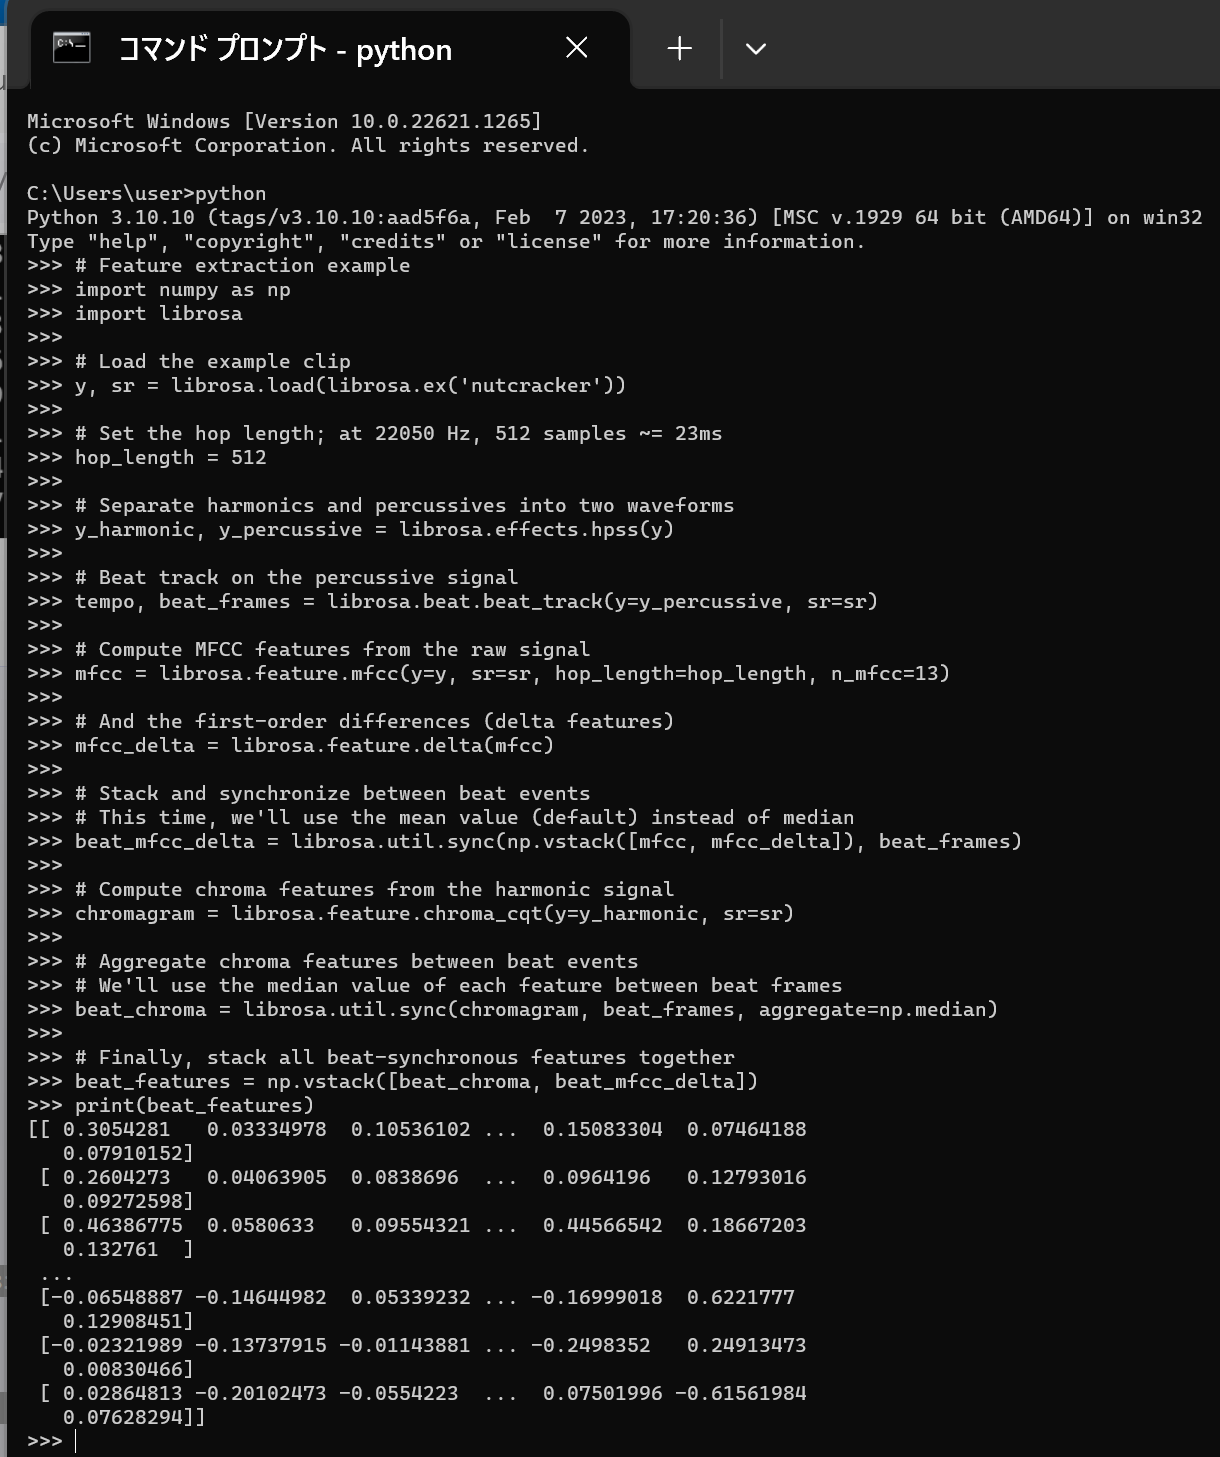
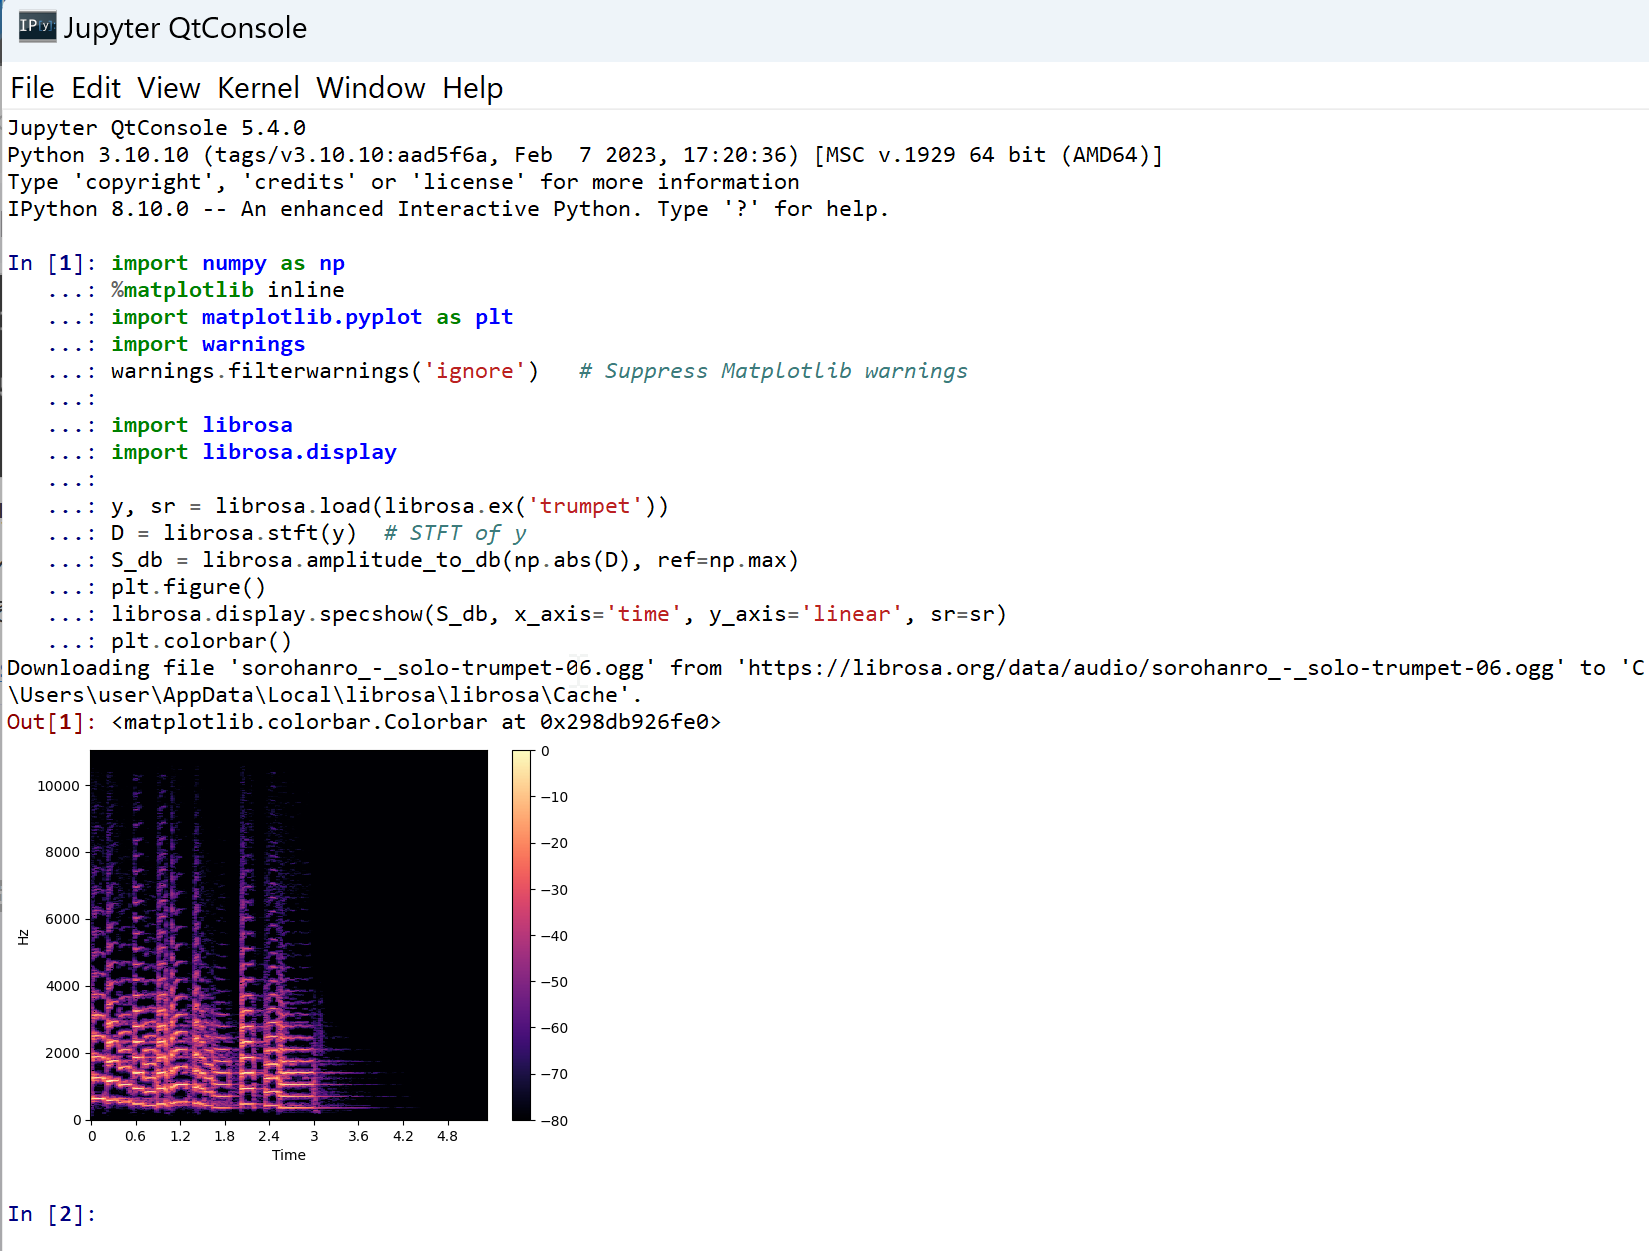
- 次の Python プログラムを実行する.Matplotlib を使うので,Jupyter QtConsole や Jupyter ノートブック (Jupyter Notebook) の利用が便利である.
次のプログラムは,librosa に付属の音声データである trumpet について,パワースペクトログラムを表示する. 次のプログラムでは,横軸は時間,縦軸は線形スケール(linear scale)で表された周波数である パワースペクトログラムを表示する. stft は short-time Fourier transform を行う. そして,その振幅により色をプロットする.
ここのプログラムのソースコードは, http://librosa.org/doc/main/auto_examples/plot_display.html#sphx-glr-auto-examples-plot-display-py のものを使用(ISC ライセンス).
import numpy as np
%matplotlib inline
import matplotlib.pyplot as plt
import warnings
warnings.filterwarnings('ignore')   # Suppress Matplotlib warnings

import librosa
import librosa.display

y, sr = librosa.load(librosa.ex('trumpet'))
D = librosa.stft(y)  # STFT of y
S_db = librosa.amplitude_to_db(np.abs(D), ref=np.max)
plt.figure()
librosa.display.specshow(S_db, x_axis='time', y_axis='linear', sr=sr)
plt.colorbar()