Pandas データフレームの基本情報の表示,散布図,要約統計量,ヒストグラム(Python, pandas, matplotlib, seaborn, Iris データセット, titanic データセットを使用)(Google Colaboratory へのリンクあり)
1. エグゼクティブサマリー
【目次】
本記事では,seaborn に付属する Iris データセットと titanic データセットを使用し,以下の操作をプログラム例とともに説明する.
- pandas データフレームの基本的な情報の表示(head, shape, ndim, columns, info(), dtypes)
- matplotlib を用いた散布図の作成
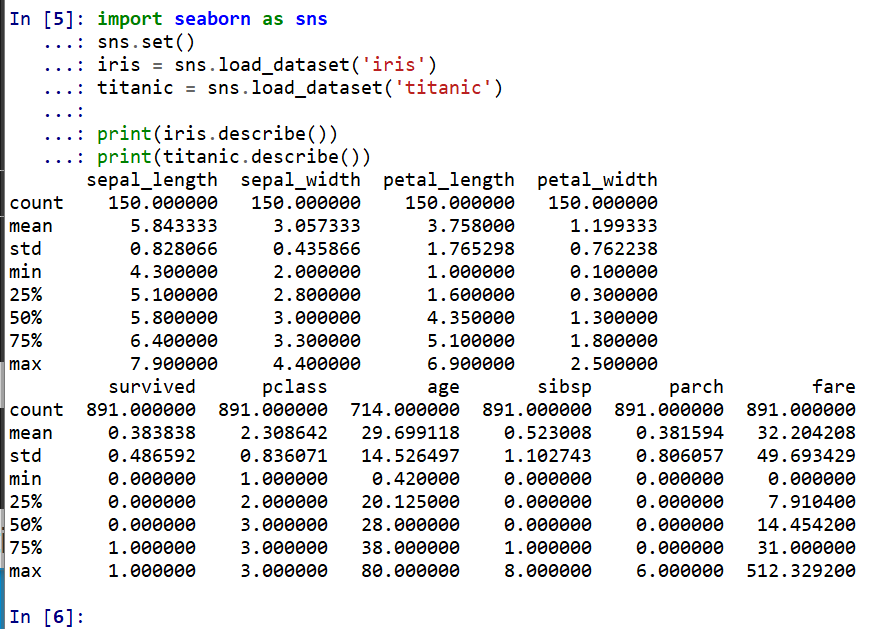
- describe() による各属性の要約統計量(総数,平均,標準偏差,最小,四分位点,中央値,最大)の表示
- matplotlib を用いたヒストグラム(1次元・2次元)の作成
Google Colaboratory のページ:
https://colab.research.google.com/drive/1LfMuE3IVYKhXb57YGdsX_dmfnTvj5oKb?usp=sharing
2. 前準備(必要ソフトウェアの入手)
ここでは、最低限の事前準備について説明する。機械学習や深層学習を行う場合は、NVIDIA CUDA、Visual Studio、Cursorなどを追加でインストールすると便利である。これらについては別ページ https://www.kkaneko.jp/cc/dev/aiassist.htmlで詳しく解説しているので、必要に応じて参照してください。
Python 3.12 のインストール(Windows 上) [クリックして展開]
以下のいずれかの方法で Python 3.12 をインストールする。Python がインストール済みの場合、この手順は不要である。
方法1:winget によるインストール
管理者権限のコマンドプロンプトで以下を実行する。管理者権限のコマンドプロンプトを起動するには、Windows キーまたはスタートメニューから「cmd」と入力し、表示された「コマンドプロンプト」を右クリックして「管理者として実行」を選択する。
winget install --id Python.Python.3.12 -e --scope machine --silent --accept-source-agreements --accept-package-agreements --override "/quiet InstallAllUsers=1 PrependPath=1 Include_test=0 Include_pip=1 Include_launcher=1 InstallLauncherAllUsers=1 TargetDir=\"C:\Program Files\Python312\""
powershell -Command "$p='C:\Program Files\Python312'; $s=\"$p\Scripts\"; $m=[Environment]::GetEnvironmentVariable('Path','Machine'); if($m -notlike \"*$s*\") { [Environment]::SetEnvironmentVariable('Path', \"$p;$s;$m\", 'Machine') }"
--scope machine を指定することで、システム全体(全ユーザー向け)にインストールされる。このオプションの実行には管理者権限が必要である。インストール完了後、コマンドプロンプトを再起動すると PATH が自動的に設定される。
方法2:インストーラーによるインストール
- Python 公式サイト(https://www.python.org/downloads/)にアクセスし、「Download Python 3.x.x」ボタンから Windows 用インストーラーをダウンロードする。
- ダウンロードしたインストーラーを実行する。
- 初期画面の下部に表示される「Add python.exe to PATH」に必ずチェックを入れてから「Customize installation」を選択する。このチェックを入れ忘れると、コマンドプロンプトから
pythonコマンドを実行できない。 - 「Install Python 3.xx for all users」にチェックを入れ、「Install」をクリックする。
インストールの確認
コマンドプロンプトで以下を実行する。
python --versionバージョン番号(例:Python 3.12.x)が表示されればインストール成功である。「'python' は、内部コマンドまたは外部コマンドとして認識されていません。」と表示される場合は、インストールが正常に完了していない。
AIエディタ Windsurf のインストール(Windows 上) [クリックして展開]
Pythonプログラムの編集・実行には、AIエディタの利用を推奨する。ここでは、Windsurfのインストールを説明する。Windsurf がインストール済みの場合、この手順は不要である。
管理者権限のコマンドプロンプトで以下を実行する。管理者権限のコマンドプロンプトを起動するには、Windows キーまたはスタートメニューから「cmd」と入力し、表示された「コマンドプロンプト」を右クリックして「管理者として実行」を選択する。
winget install --scope machine --id Codeium.Windsurf -e --silent --disable-interactivity --force --accept-source-agreements --accept-package-agreements --custom "/SP- /SUPPRESSMSGBOXES /NORESTART /CLOSEAPPLICATIONS /DIR=""C:\Program Files\Windsurf"" /MERGETASKS=!runcode,addtopath,associatewithfiles,!desktopicon"
powershell -Command "$env:Path=[System.Environment]::GetEnvironmentVariable('Path','Machine')+';'+[System.Environment]::GetEnvironmentVariable('Path','User'); windsurf --install-extension MS-CEINTL.vscode-language-pack-ja --force; windsurf --install-extension ms-python.python --force; windsurf --install-extension Codeium.windsurfPyright --force"
--scope machine を指定することで、システム全体(全ユーザー向け)にインストールされる。このオプションの実行には管理者権限が必要である。インストール完了後、コマンドプロンプトを再起動すると PATH が自動的に設定される。
【関連する外部ページ】
Windsurf の公式ページ: https://windsurf.com/
必要なライブラリのインストール [クリックして展開]
管理者権限のコマンドプロンプトで以下を実行する.管理者権限のコマンドプロンプトを起動するには,Windows キーまたはスタートメニューから「cmd」と入力し,表示された「コマンドプロンプト」を右クリックして「管理者として実行」を選択する.
python -m pip install -U pip setuptools numpy pandas matplotlib seaborn scikit-learn scikit-learn-intelex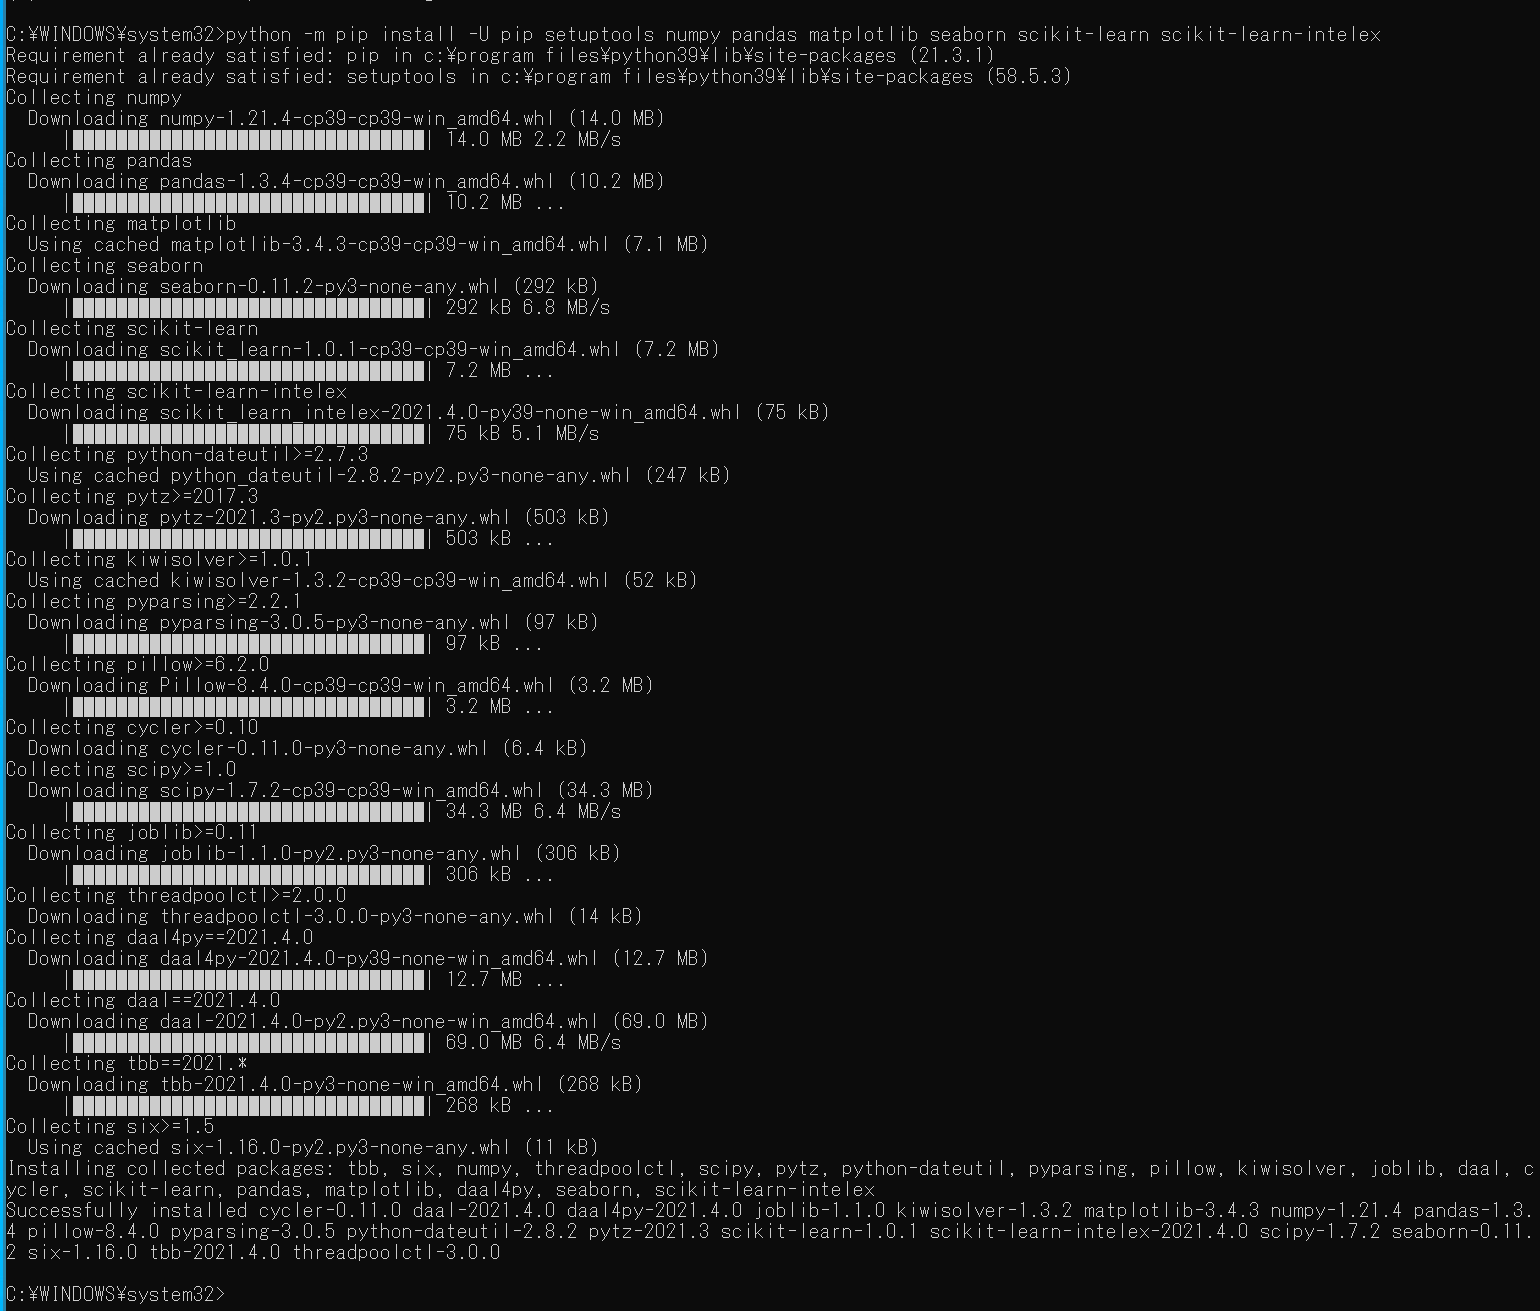
3. 実行のための準備とその確認手順(Windows 前提)
3.1 プログラムファイルの準備
第5章のソースコードをテキストエディタ(メモ帳,Windsurf 等)に貼り付け,main.py として保存する(文字コード:UTF-8).コード中の %matplotlib inline は Jupyter Notebook / Google Colaboratory 向けの記述であり,通常の Python スクリプトとして実行する場合は削除すること.
3.2 実行コマンド
コマンドプロンプトでファイルの保存先ディレクトリに移動し,以下を実行する.
python main.pyGoogle Colaboratory を使用する場合は,以下のリンクからノートブックを開き,各セルを順に実行する.
https://colab.research.google.com/drive/1LfMuE3IVYKhXb57YGdsX_dmfnTvj5oKb?usp=sharing
3.3 動作確認チェックリスト
| 確認項目 | 期待される結果 |
|---|---|
| iris, titanic データセットの読み込み | エラーなく読み込まれ,head() で先頭5行が表示される |
| 基本的な情報の表示(iris) | head(), info(), shape, ndim, columns, dtypes の各結果が表示される |
| 基本的な情報の表示(titanic) | head(), info(), shape, ndim, columns, dtypes の各結果が表示される |
| Iris データセットの1列目・2列目の表示 | iris.iloc[:,1] と iris.iloc[:,2] の値が表示される |
| 散布図の表示 | 1列目と2列目の散布図(赤い丸)が軸ラベル付きで表示される |
| 要約統計量の表示 | describe() により,総数,平均,標準偏差,最小,四分位点,中央値,最大が表示される |
| 1次元ヒストグラムの表示 | 1列目,2列目それぞれのヒストグラムが軸ラベル付きで表示される |
| 2次元ヒストグラムの表示 | 1列目と2列目の2次元ヒストグラムが軸ラベルおよびカラーバー付きで表示される |
4. 概要・使い方・実行上の注意
4.1 データセットの準備
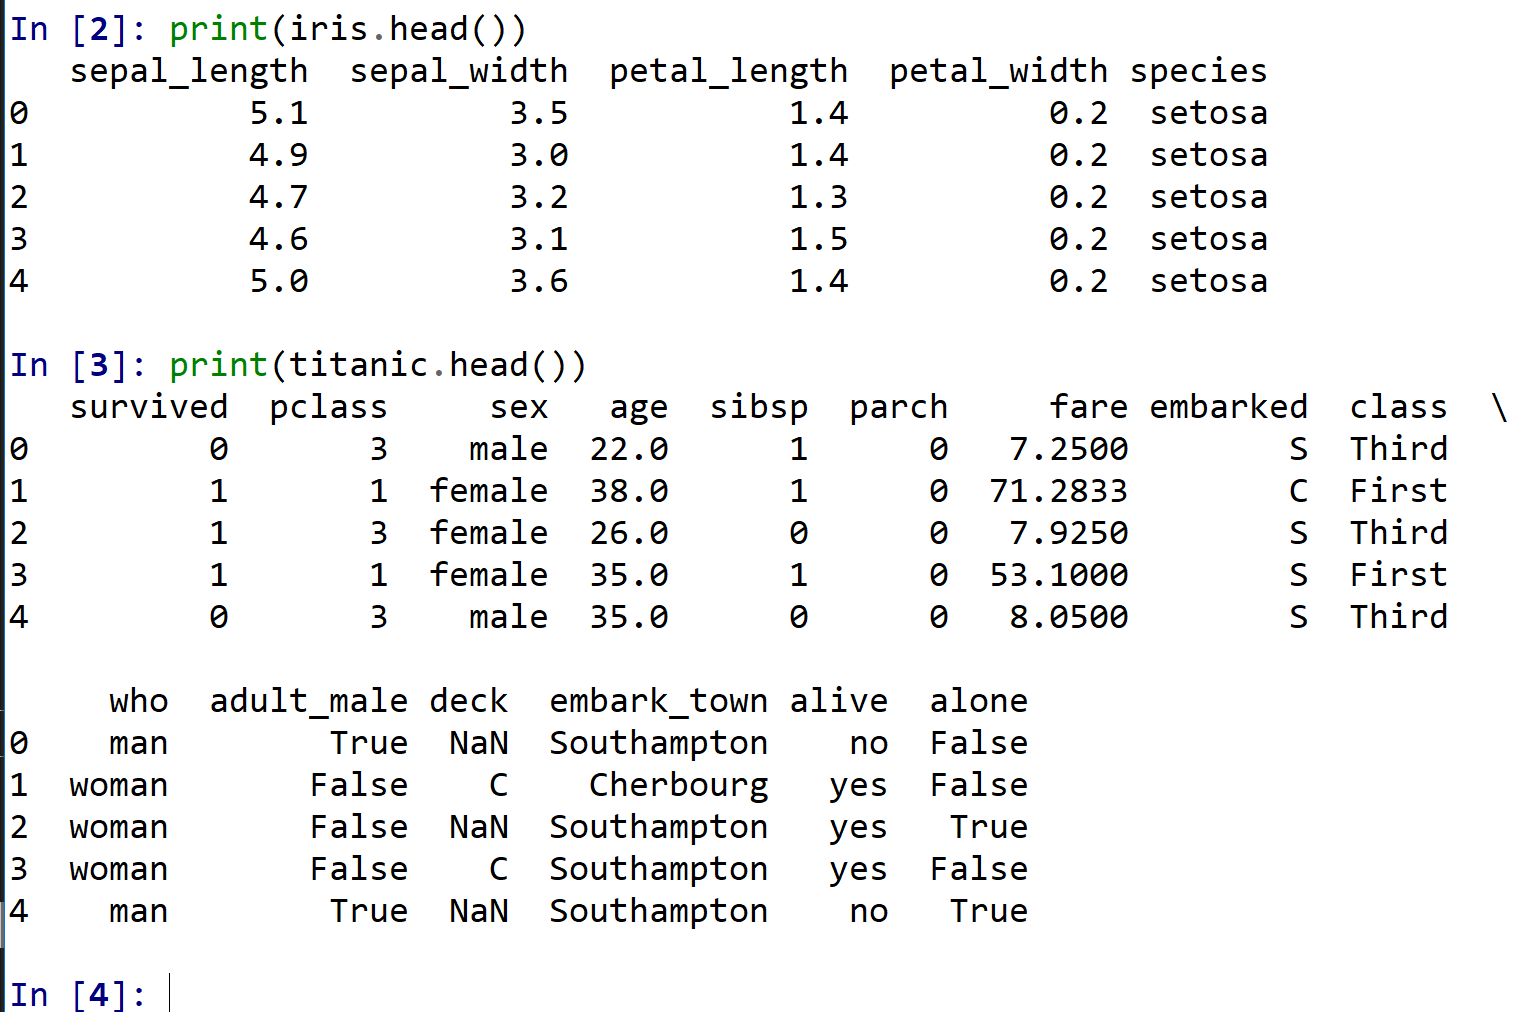
seaborn の load_dataset 関数で Iris データセットと titanic データセットを読み込み,head() で先頭部分を確認する.
4.2 基本的な情報の表示
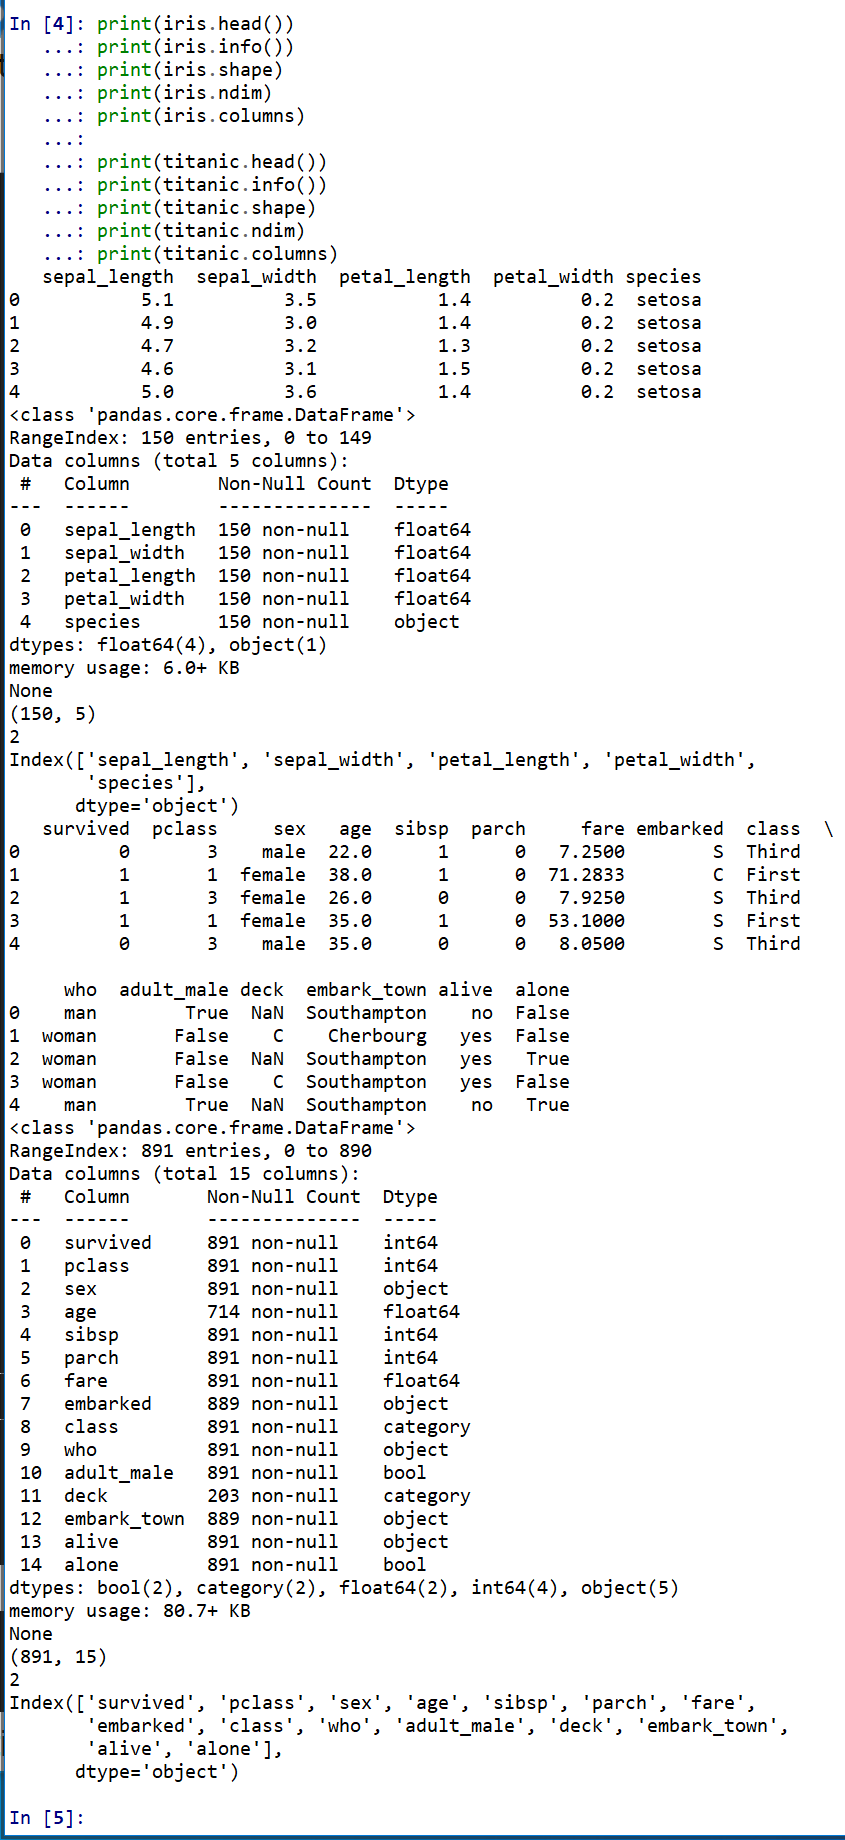
pandas データフレームの基本情報は,以下のメソッド・属性で表示できる.
- head: 先頭部分の表示
- shape: サイズ
- ndim: 次元数
- columns: 属性名
- info(): 各属性のデータ型
- dtypes: 各属性のデータ型一覧
4.3 散布図
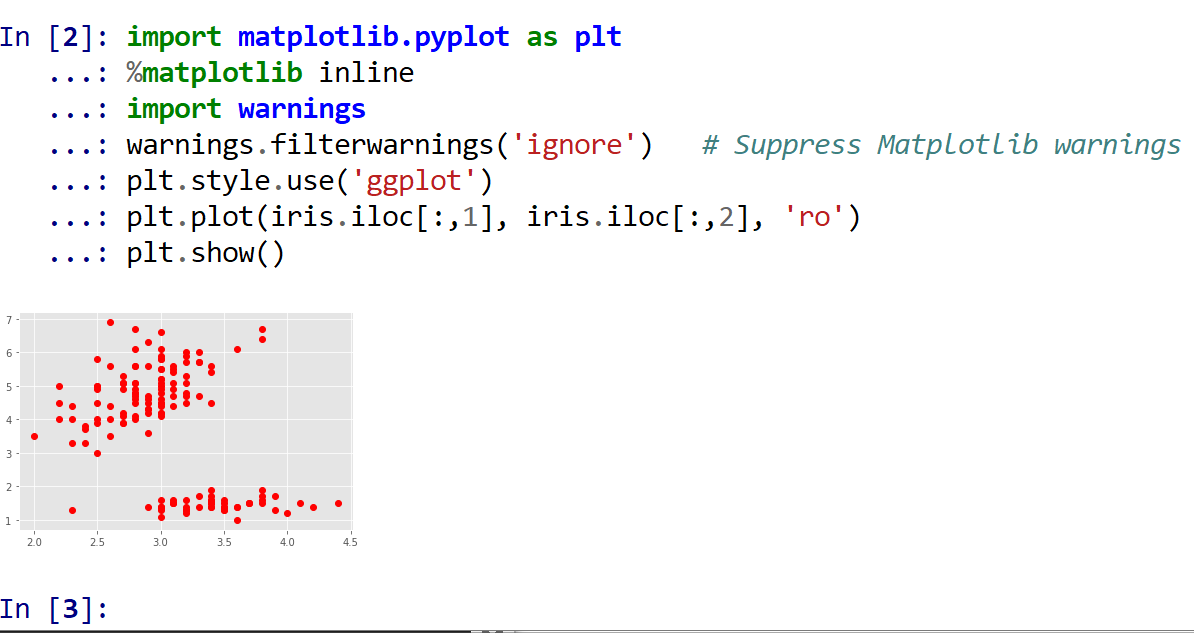
iloc で Iris データセットの特定の列を取り出し,plt.plot で散布図を描画する.オブジェクト iris には 0, 1, 2, 3, 4列目がある.「plt.style.use('ggplot')」はグラフの書式設定,「ro」は赤い丸のマーカー指定である.
4.4 各属性の要約統計量
describe() で各属性の要約統計量(総数,平均,標準偏差,最小,四分位点,中央値,最大)を表示する.
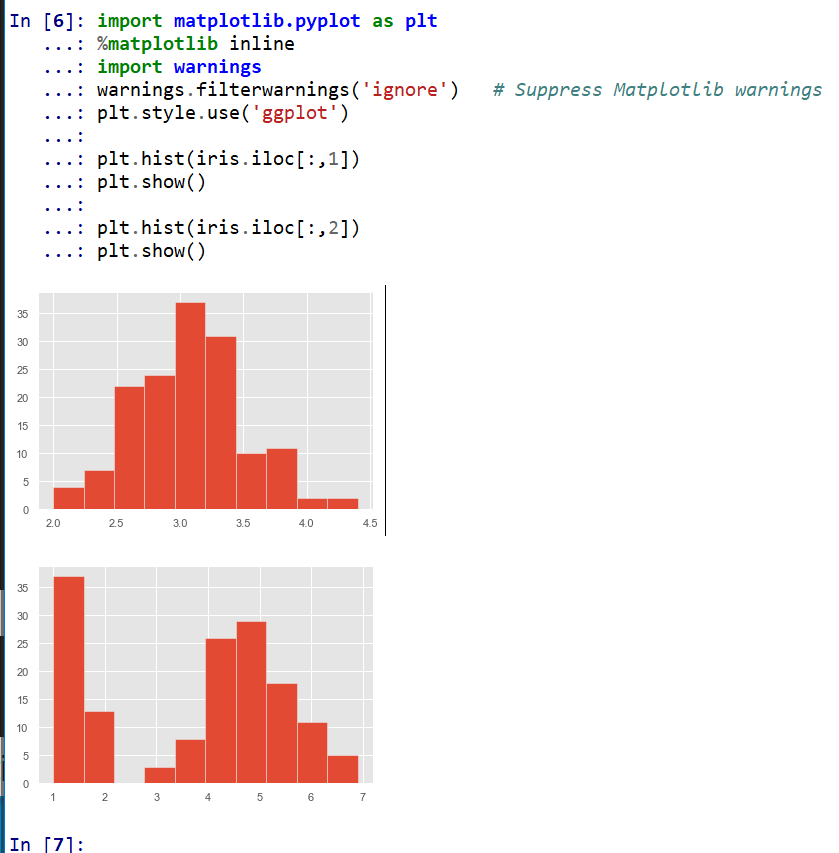
4.5 ヒストグラム
plt.hist で1次元ヒストグラムを,plt.hist2d で2次元ヒストグラムを描画する.対象は Iris データセットの1列目と2列目である.
5. ソースコード
5.1 iris, titanic データセットの読み込み
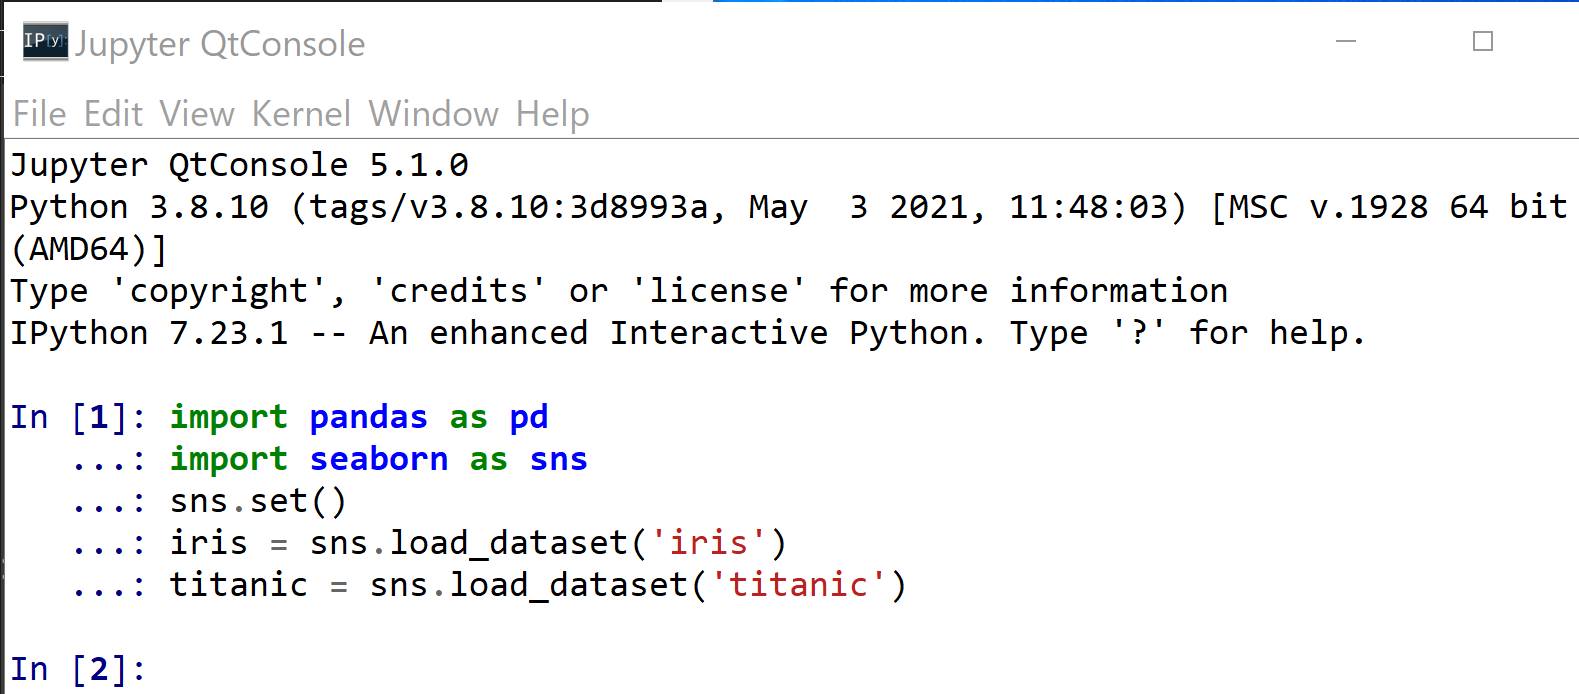
import pandas as pd
import seaborn as sns
sns.set()
iris = sns.load_dataset('iris')
titanic = sns.load_dataset('titanic')
5.2 データの確認
print(iris.head())
print(titanic.head())
5.3 基本的な情報の表示
print(iris.head())
print(iris.info())
print(iris.shape)
print(iris.ndim)
print(iris.columns)
print(iris.dtypes)

print(titanic.head())
print(titanic.info())
print(titanic.shape)
print(titanic.ndim)
print(titanic.columns)
print(titanic.dtypes)
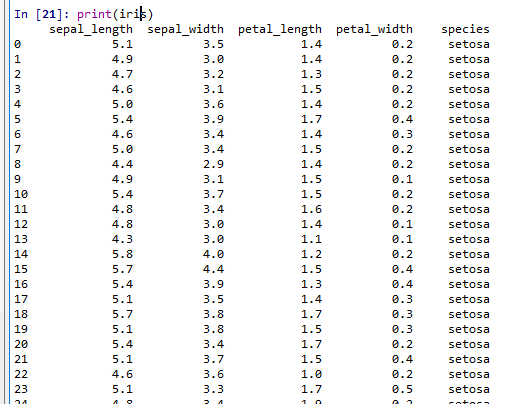
5.4 読み込んだ Iris データセットの表示
print(iris)
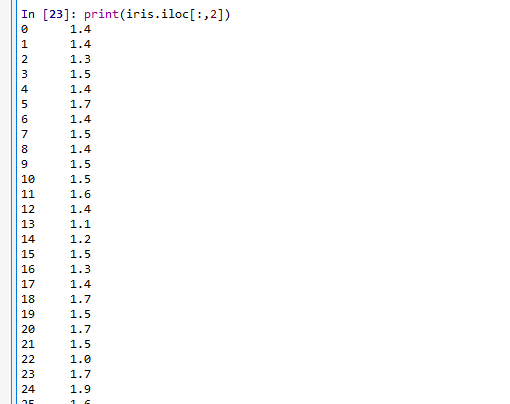
5.5 Iris データセットのうち,1列目と2列目の表示
* オブジェクト iris には 0, 1, 2, 3, 4列目がある.
print(iris.iloc[:,1])
print(iris.iloc[:,2])
5.6 Iris データセットについて,1列目と2列目の散布図
「plt.style.use('ggplot')」はグラフの書式設定である.「ro」は赤い丸のマーカー指定である.
%matplotlib inline
import matplotlib.pyplot as plt
plt.style.use('ggplot')
plt.plot(iris.iloc[:,1], iris.iloc[:,2], 'ro')
plt.xlabel(iris.columns[1])
plt.ylabel(iris.columns[2])
plt.show()
5.7 各属性の要約統計量(総数,平均,標準偏差,最小,四分位点,中央値,最大)
import seaborn as sns
sns.set()
iris = sns.load_dataset('iris')
titanic = sns.load_dataset('titanic')

print(iris.describe())
print(titanic.describe())
5.8 ヒストグラム
%matplotlib inline
import matplotlib.pyplot as plt
plt.style.use('ggplot')

plt.hist(iris.iloc[:,1])
plt.xlabel(iris.columns[1])
plt.show()

plt.hist(iris.iloc[:,2])
plt.xlabel(iris.columns[2])
plt.show()
5.9 2次元ヒストグラム
%matplotlib inline
import matplotlib.pyplot as plt
plt.style.use('ggplot')

plt.hist2d(iris.iloc[:,1], iris.iloc[:,2])
plt.xlabel(iris.columns[1])
plt.ylabel(iris.columns[2])
plt.colorbar()
plt.show()
6. まとめ
本記事で扱った主要概念を以下に整理する.
6.1 pandas データフレームの基本情報表示
head, shape, ndim, columns, info(), dtypes により,先頭部分,サイズ,次元数,属性名,データ型を確認できる.
6.2 seaborn によるデータセットの読み込み
load_dataset 関数で Iris データセットや titanic データセットを pandas データフレームとして読み込める.
6.3 散布図
plt.plot と iloc で特定の列を対象に散布図を描画できる.plt.style.use('ggplot') でグラフの書式を設定し,「ro」で赤い丸のマーカーを指定する.
6.4 要約統計量
describe() で総数,平均,標準偏差,最小,四分位点,中央値,最大を一覧表示できる.
6.5 ヒストグラム
plt.hist で1次元ヒストグラムを,plt.hist2d で2次元ヒストグラムを描画できる.2次元ヒストグラムでは plt.colorbar() でカラーバーを表示し,度数分布を色で確認できる.