Python で GeoTIFF を使ってみる
キーワード: GeoTIFF, Python で GeoTIFF ファイルの読み込み,Python で GeoTIFF ファイルからの緯度経度の取得,osr, gdal, 基盤地図情報, 数値標高モデル, 基盤地図情報ダウンロード
前準備
Python 3.12 のインストール(Windows 上) [クリックして展開]
以下のいずれかの方法で Python 3.12 をインストールする。Python がインストール済みの場合、この手順は不要である。
方法1:winget によるインストール
管理者権限のコマンドプロンプトで以下を実行する。管理者権限のコマンドプロンプトを起動するには、Windows キーまたはスタートメニューから「cmd」と入力し、表示された「コマンドプロンプト」を右クリックして「管理者として実行」を選択する。
winget install --id Python.Python.3.12 -e --scope machine --silent --accept-source-agreements --accept-package-agreements --override "/quiet InstallAllUsers=1 PrependPath=1 Include_test=0 Include_pip=1 Include_launcher=1 InstallLauncherAllUsers=1 TargetDir=\"C:\Program Files\Python312\""
powershell -Command "$p='C:\Program Files\Python312'; $s=\"$p\Scripts\"; $m=[Environment]::GetEnvironmentVariable('Path','Machine'); if($m -notlike \"*$s*\") { [Environment]::SetEnvironmentVariable('Path', \"$p;$s;$m\", 'Machine') }"
--scope machine を指定することで、システム全体(全ユーザー向け)にインストールされる。このオプションの実行には管理者権限が必要である。インストール完了後、コマンドプロンプトを再起動すると PATH が自動的に設定される。
方法2:インストーラーによるインストール
- Python 公式サイト(https://www.python.org/downloads/)にアクセスし、「Download Python 3.x.x」ボタンから Windows 用インストーラーをダウンロードする。
- ダウンロードしたインストーラーを実行する。
- 初期画面の下部に表示される「Add python.exe to PATH」に必ずチェックを入れてから「Customize installation」を選択する。このチェックを入れ忘れると、コマンドプロンプトから
pythonコマンドを実行できない。 - 「Install Python 3.xx for all users」にチェックを入れ、「Install」をクリックする。
インストールの確認
コマンドプロンプトで以下を実行する。
python --versionバージョン番号(例:Python 3.12.x)が表示されればインストール成功である。「'python' は、内部コマンドまたは外部コマンドとして認識されていません。」と表示される場合は、インストールが正常に完了していない。
AIエディタ Windsurf のインストール(Windows 上) [クリックして展開]
Pythonプログラムの編集・実行には、AIエディタの利用を推奨する。ここでは、Windsurfのインストールを説明する。Windsurf がインストール済みの場合、この手順は不要である。
管理者権限のコマンドプロンプトで以下を実行する。管理者権限のコマンドプロンプトを起動するには、Windows キーまたはスタートメニューから「cmd」と入力し、表示された「コマンドプロンプト」を右クリックして「管理者として実行」を選択する。
winget install --scope machine --id Codeium.Windsurf -e --silent --disable-interactivity --force --accept-source-agreements --accept-package-agreements --custom "/SP- /SUPPRESSMSGBOXES /NORESTART /CLOSEAPPLICATIONS /DIR=""C:\Program Files\Windsurf"" /MERGETASKS=!runcode,addtopath,associatewithfiles,!desktopicon"
powershell -Command "$env:Path=[System.Environment]::GetEnvironmentVariable('Path','Machine')+';'+[System.Environment]::GetEnvironmentVariable('Path','User'); windsurf --install-extension MS-CEINTL.vscode-language-pack-ja --force; windsurf --install-extension ms-python.python --force; windsurf --install-extension Codeium.windsurfPyright --force"
--scope machine を指定することで、システム全体(全ユーザー向け)にインストールされる。このオプションの実行には管理者権限が必要である。インストール完了後、コマンドプロンプトを再起動すると PATH が自動的に設定される。
【関連する外部ページ】
Windsurf の公式ページ: https://windsurf.com/
gdal Windows 版のインストール
OSGeo4W のインストールを行っておくこと
GeoTIFF サンプルデータファイルの準備 (1)
- GeoTIFF サンプルデータファイルのダウンロード
次の Web ページから cea.tif をダウンロード
http://download.osgeo.org/geotiff/samples/gdal_eg/
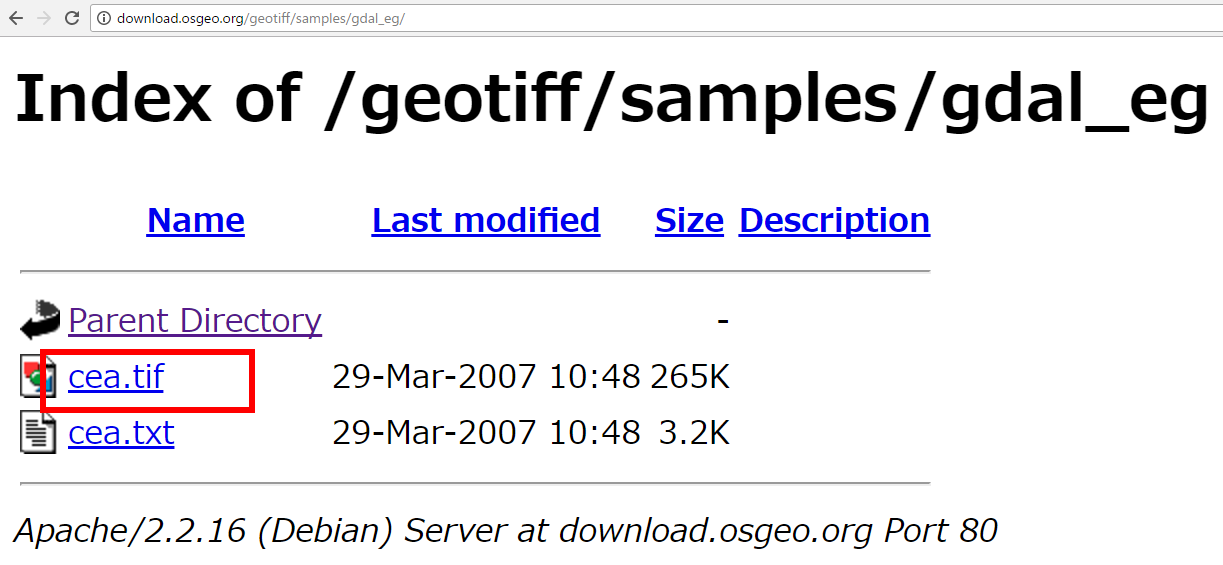
- ダウンロードした .tif ファイルを,分かりやすいディレクトリ(例えばd:\)に保存
GeoTIFF サンプルデータファイルの準備 (基盤地図情報の数値標高モデル)
【関連する外部ページ】 http://sanvarie.hatenablog.com/entry/2016/01/10/163027
ありがとうございます.
基盤地図情報・数値標高モデルのダウンロード
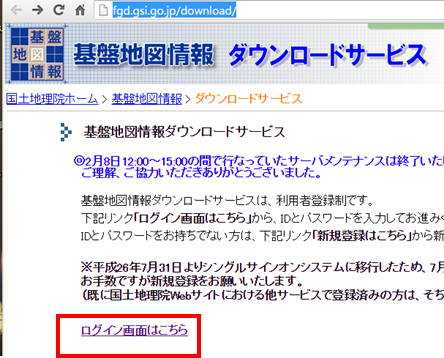
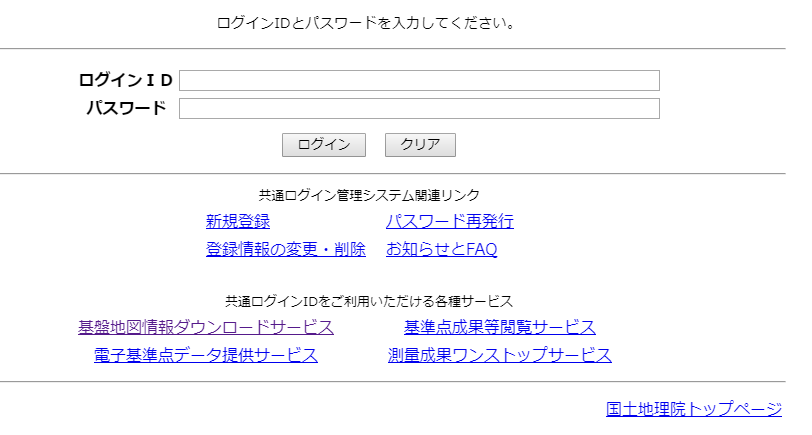
- 国土地理院の「基盤地図情報ダウンロード」の Web ページを開く
- 「ログイン画面はこちら」をクリック
- 「基盤地図情報・数値標高モデル」の下の
「ファイル選択へ」をクリック
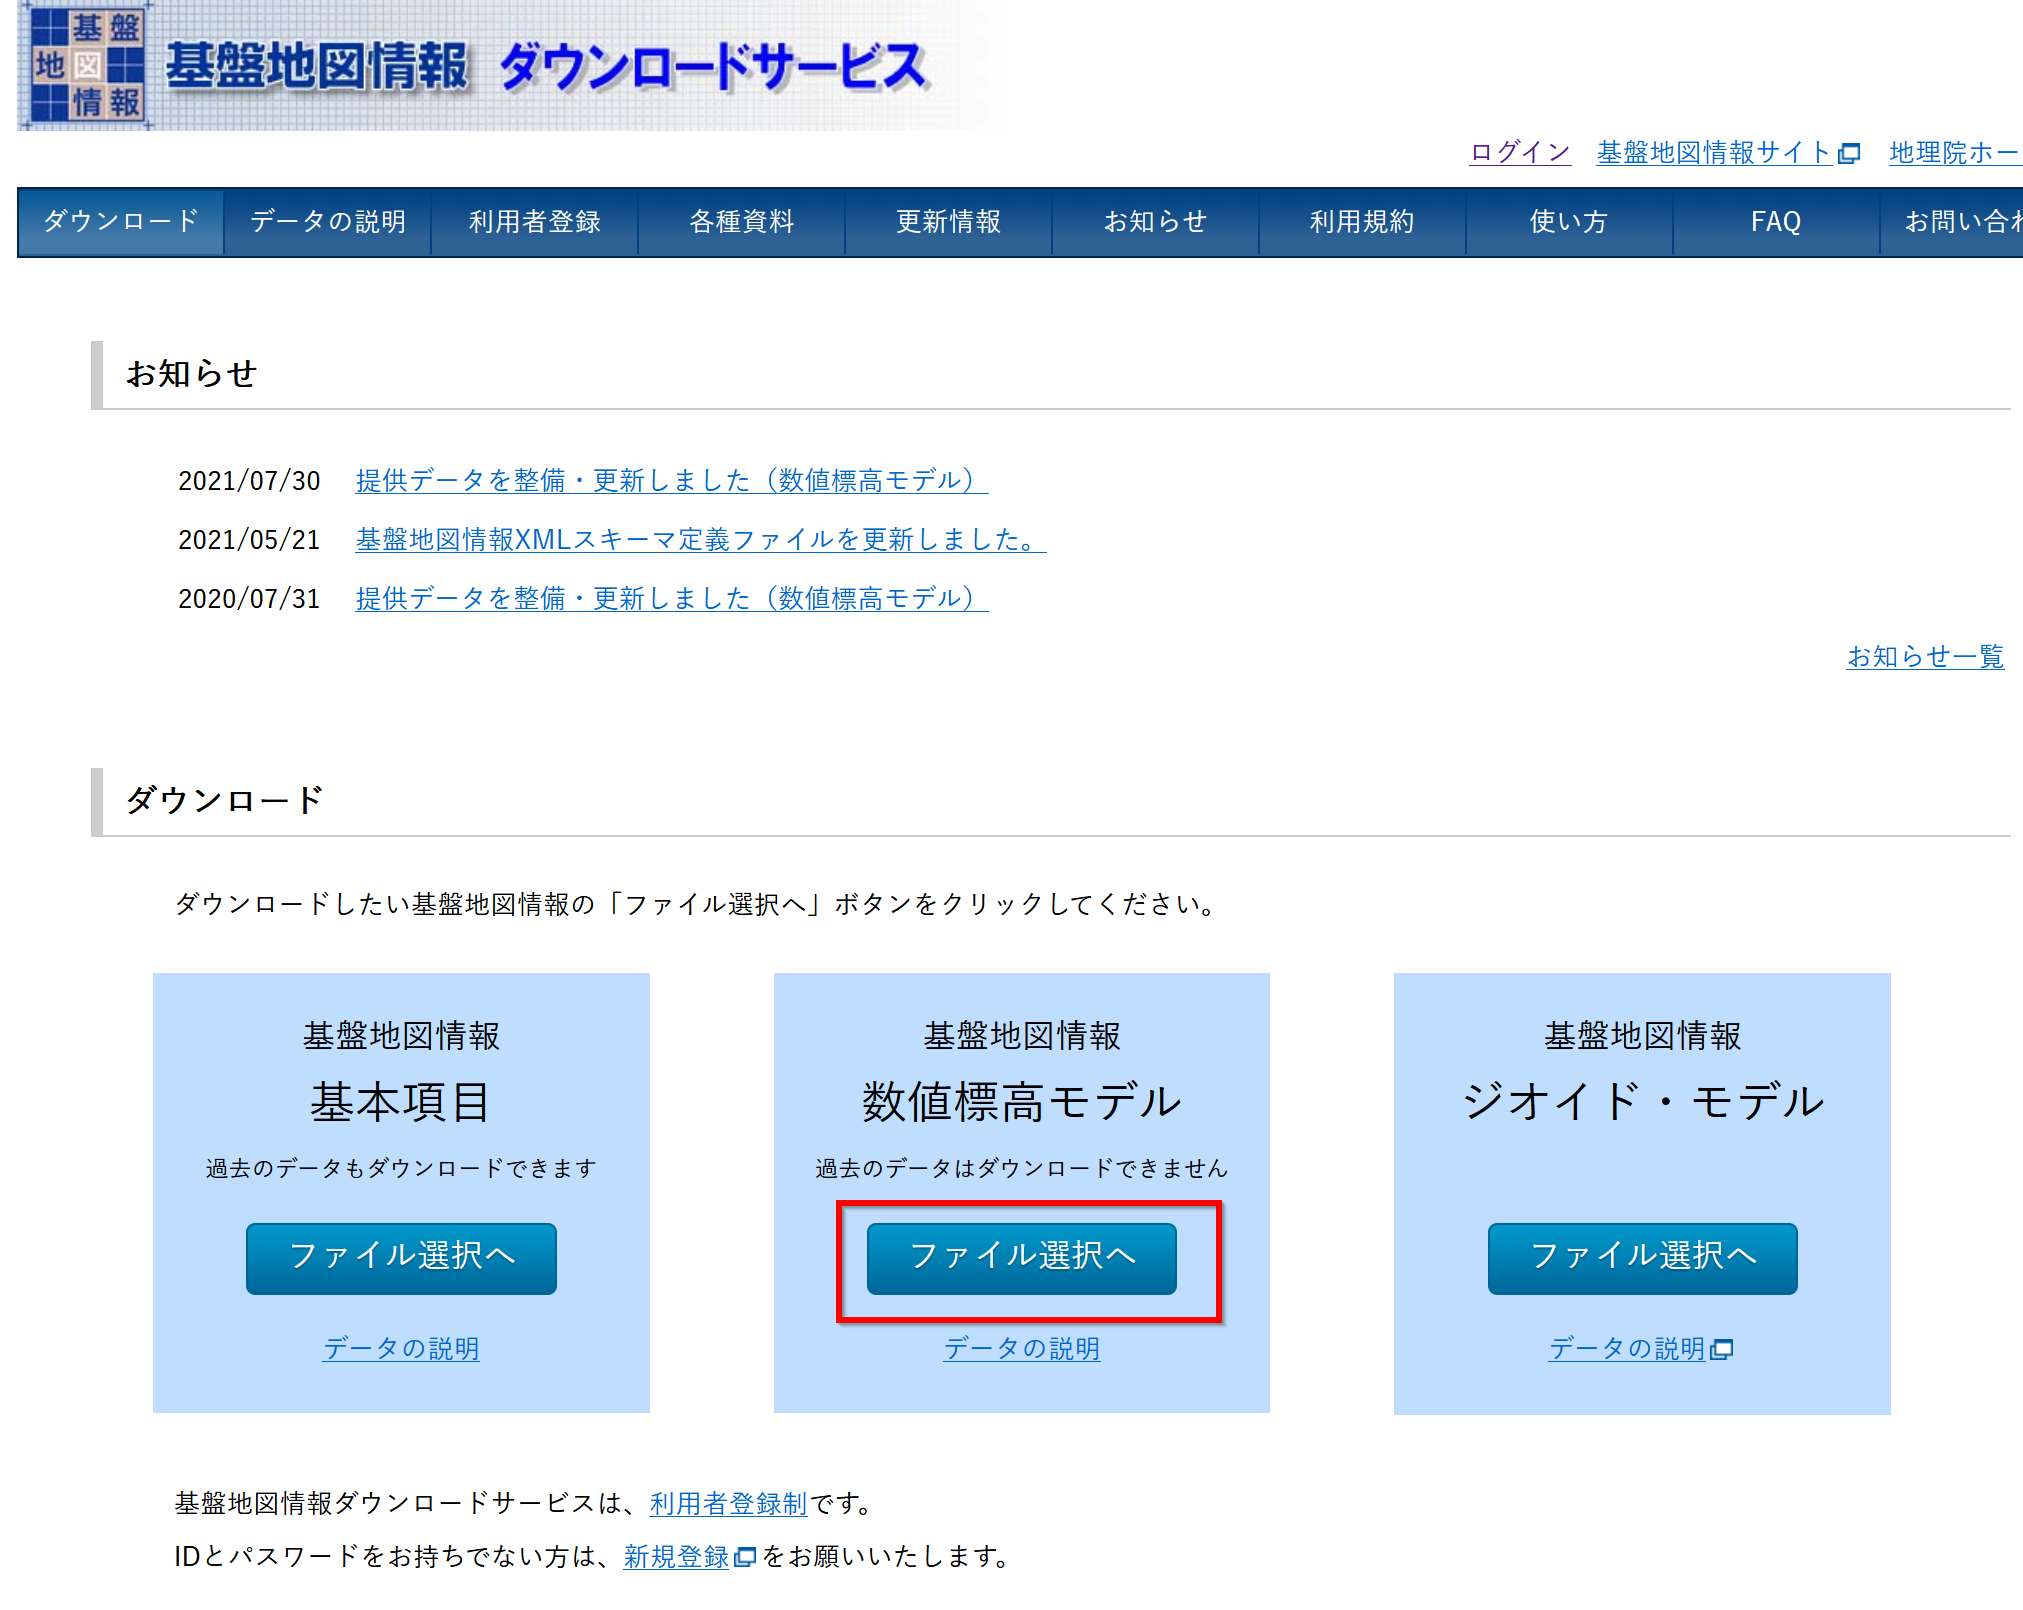
- ダウンロードしたい数値標高モデルの範囲を選ぶ
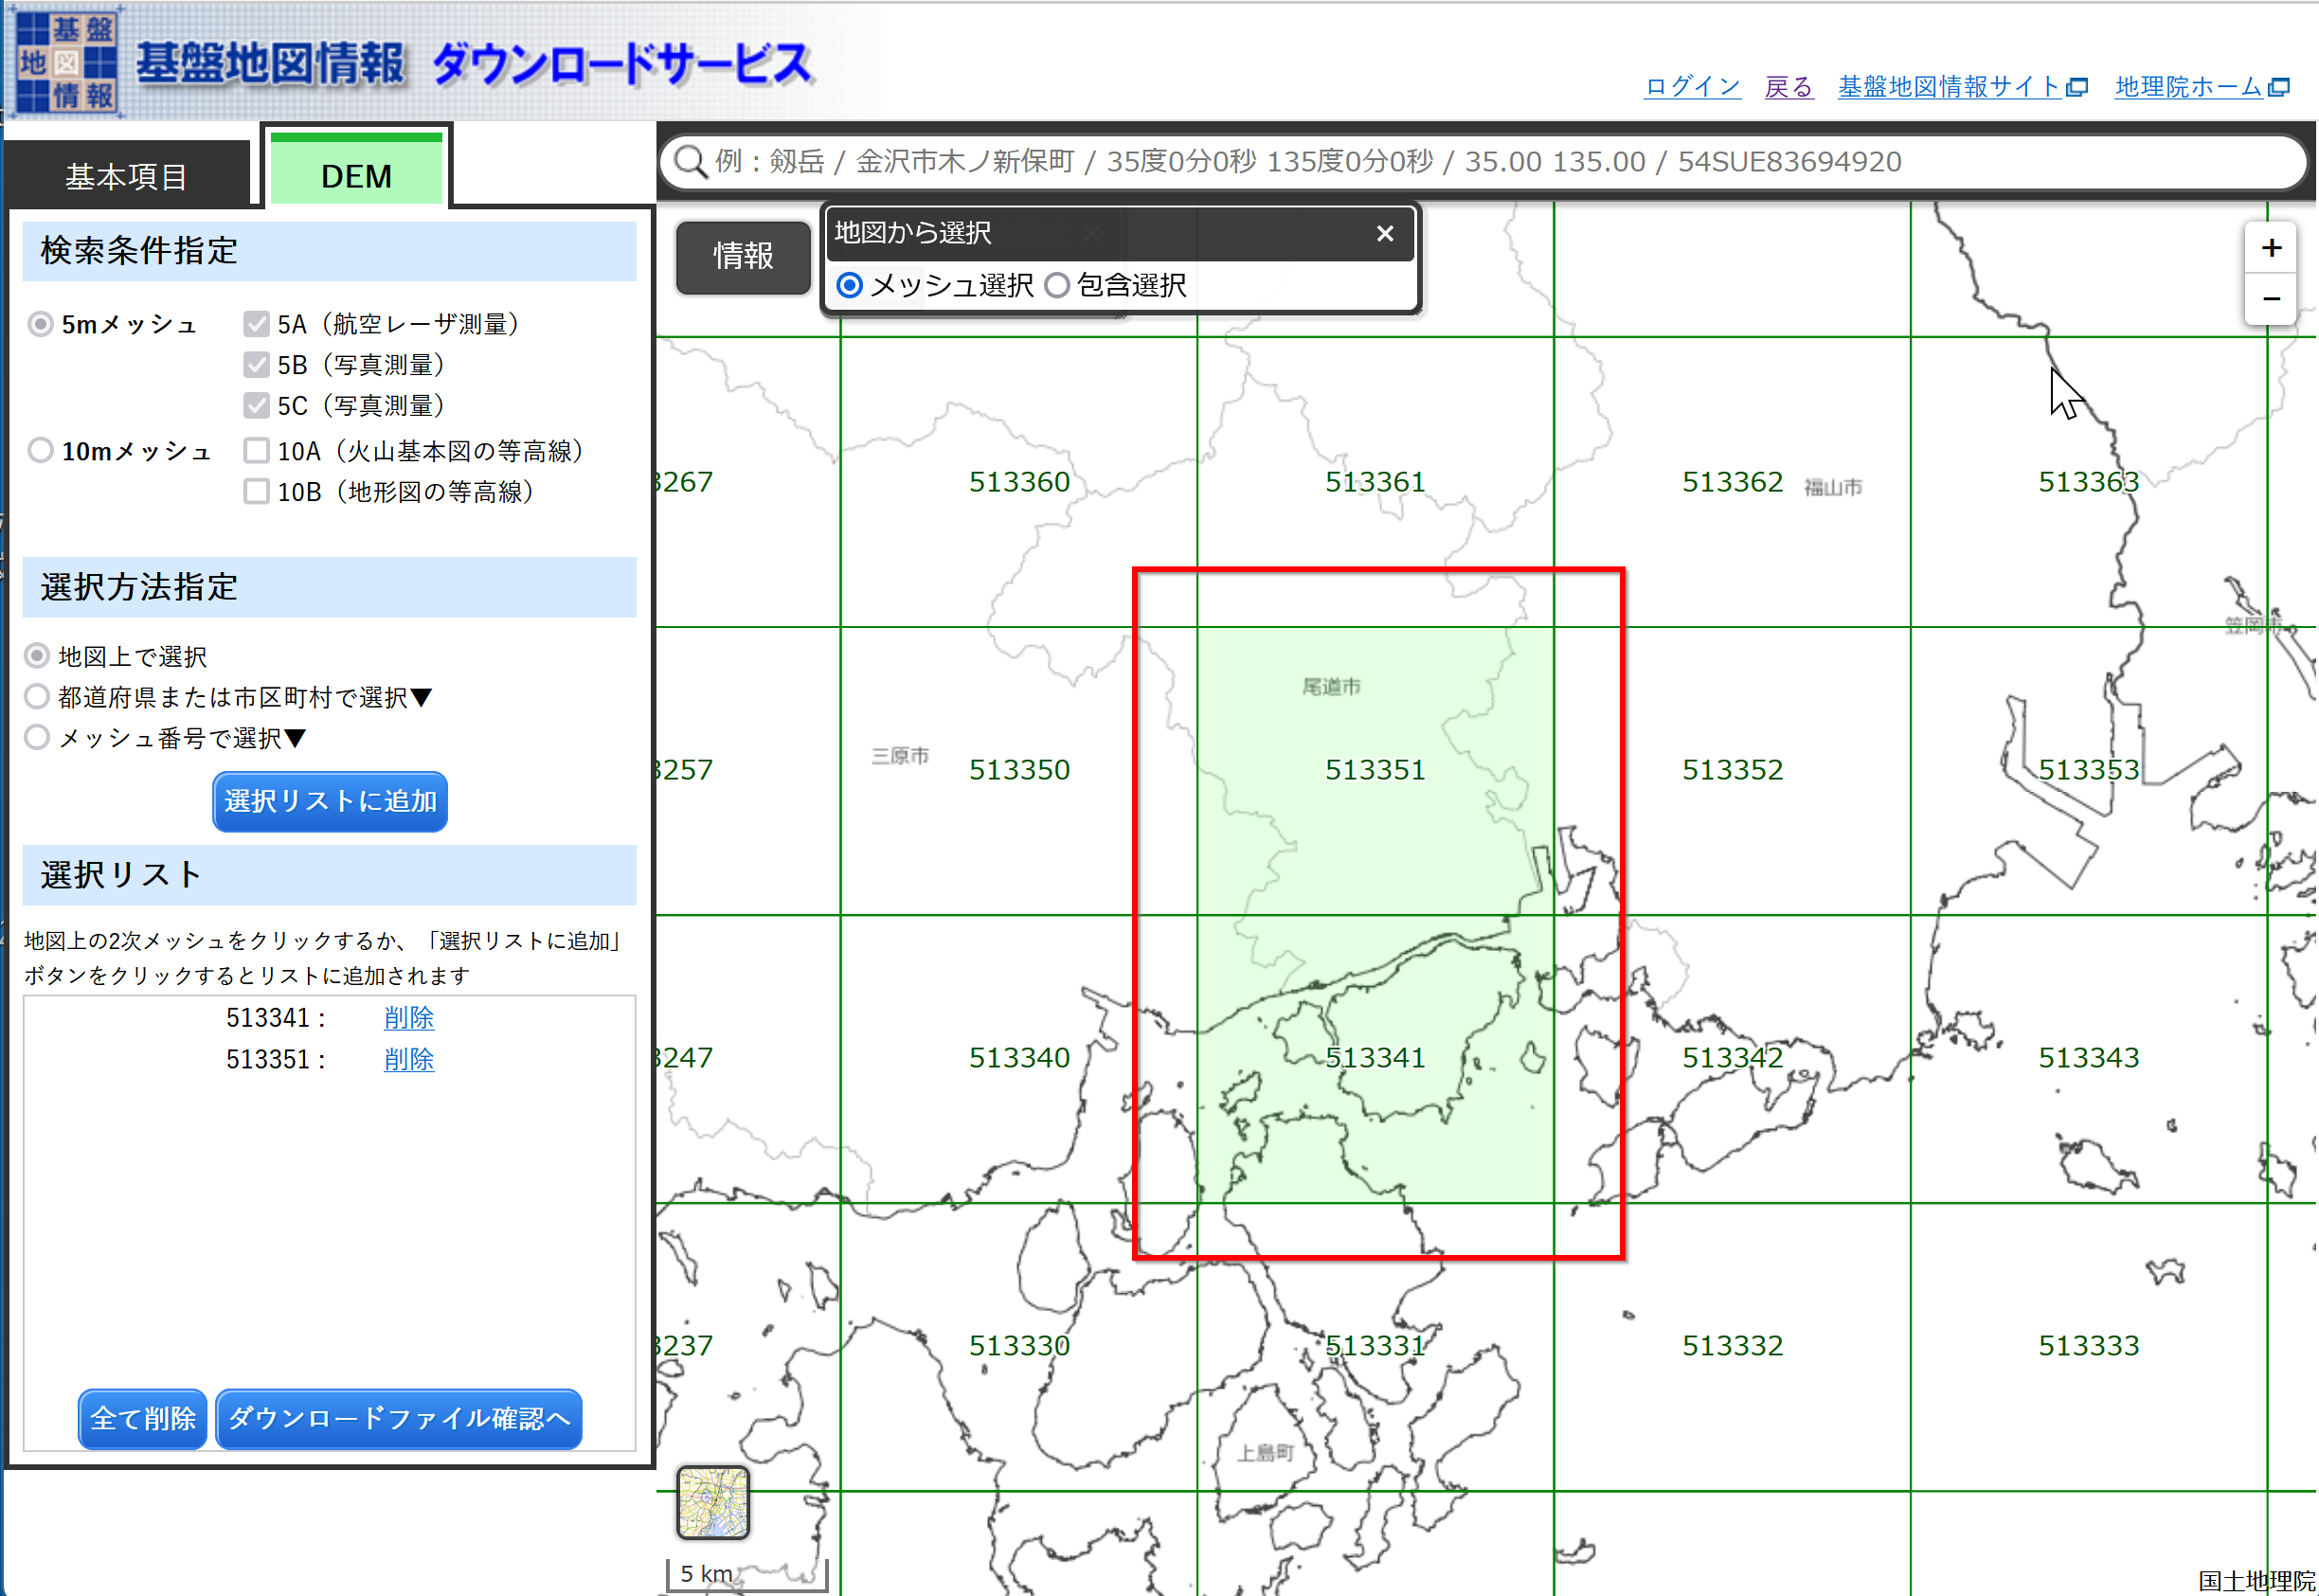
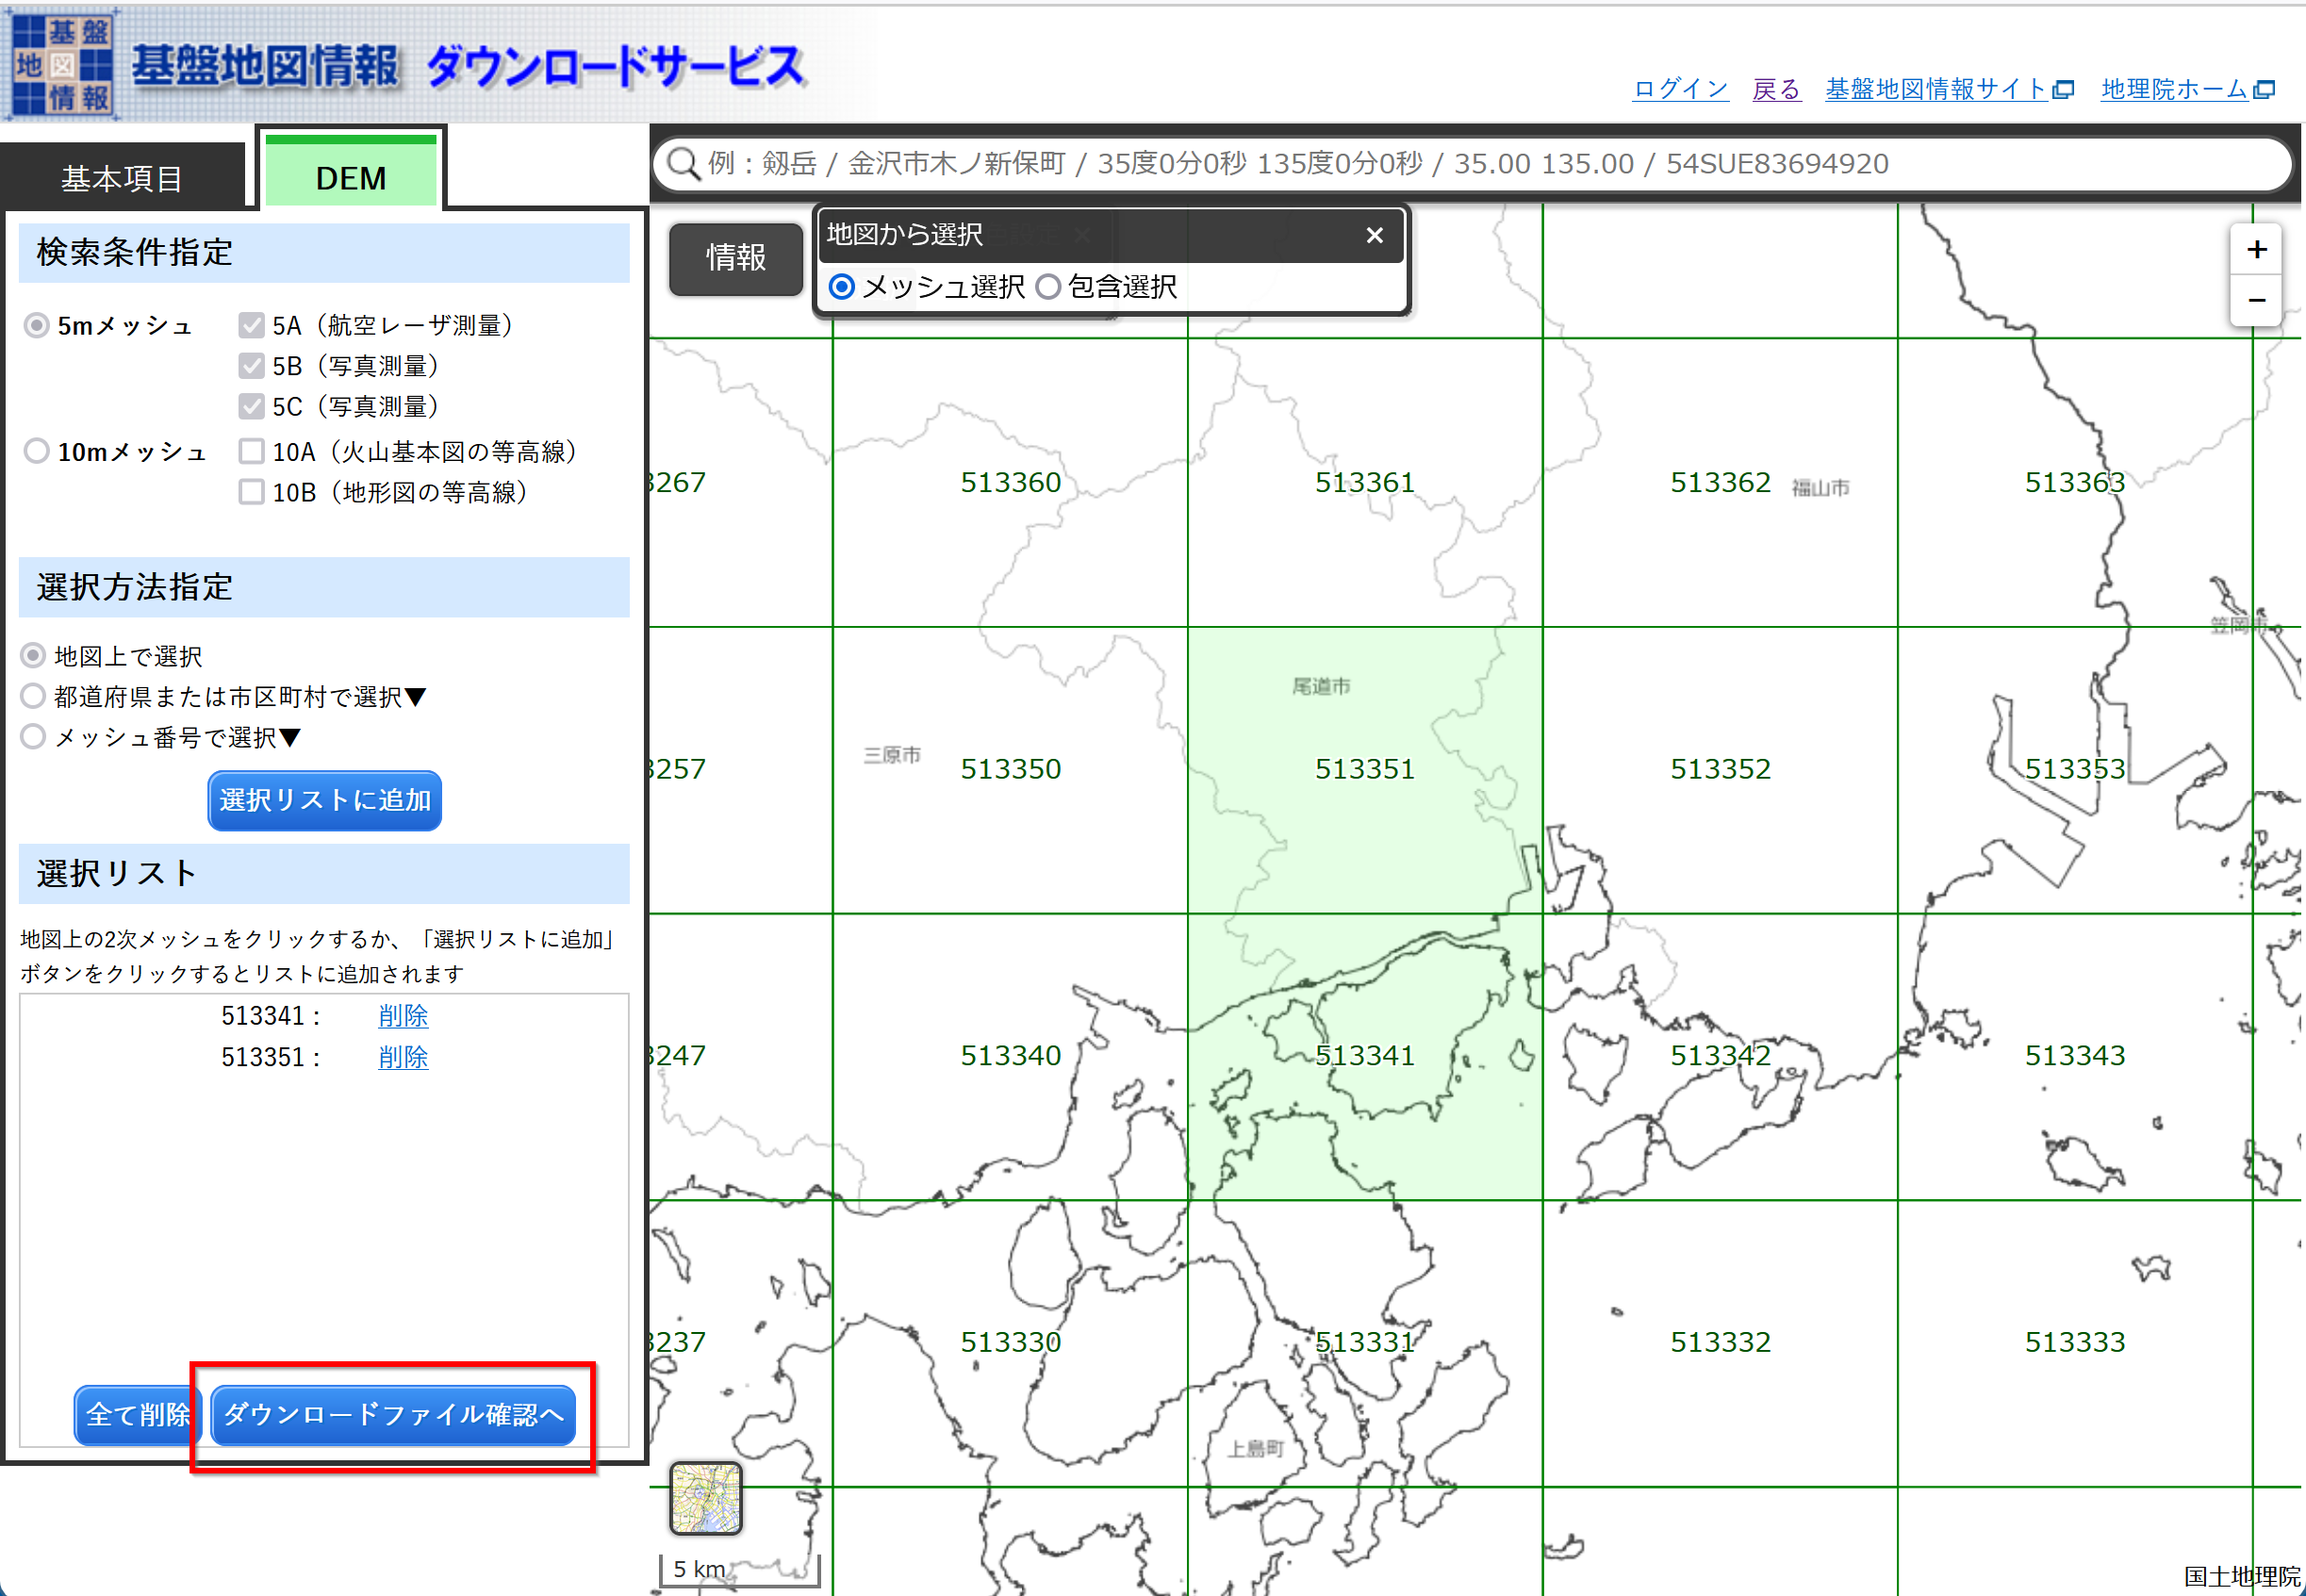
- 選び終わったら,「ダウンロードファイル確認へ」をクリック
- 「すべてチェック」をクリック
* 「5A」は航空レーザー測量,「5B」は写真測量.
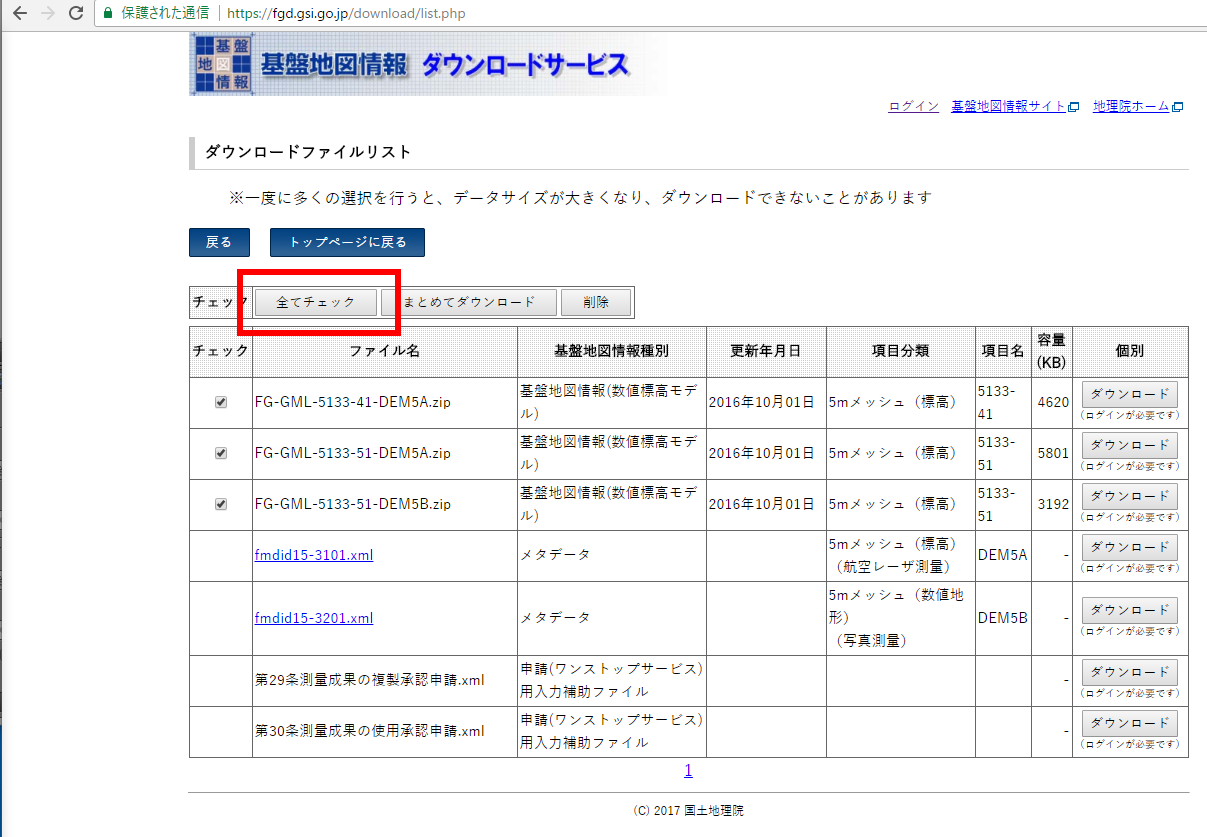
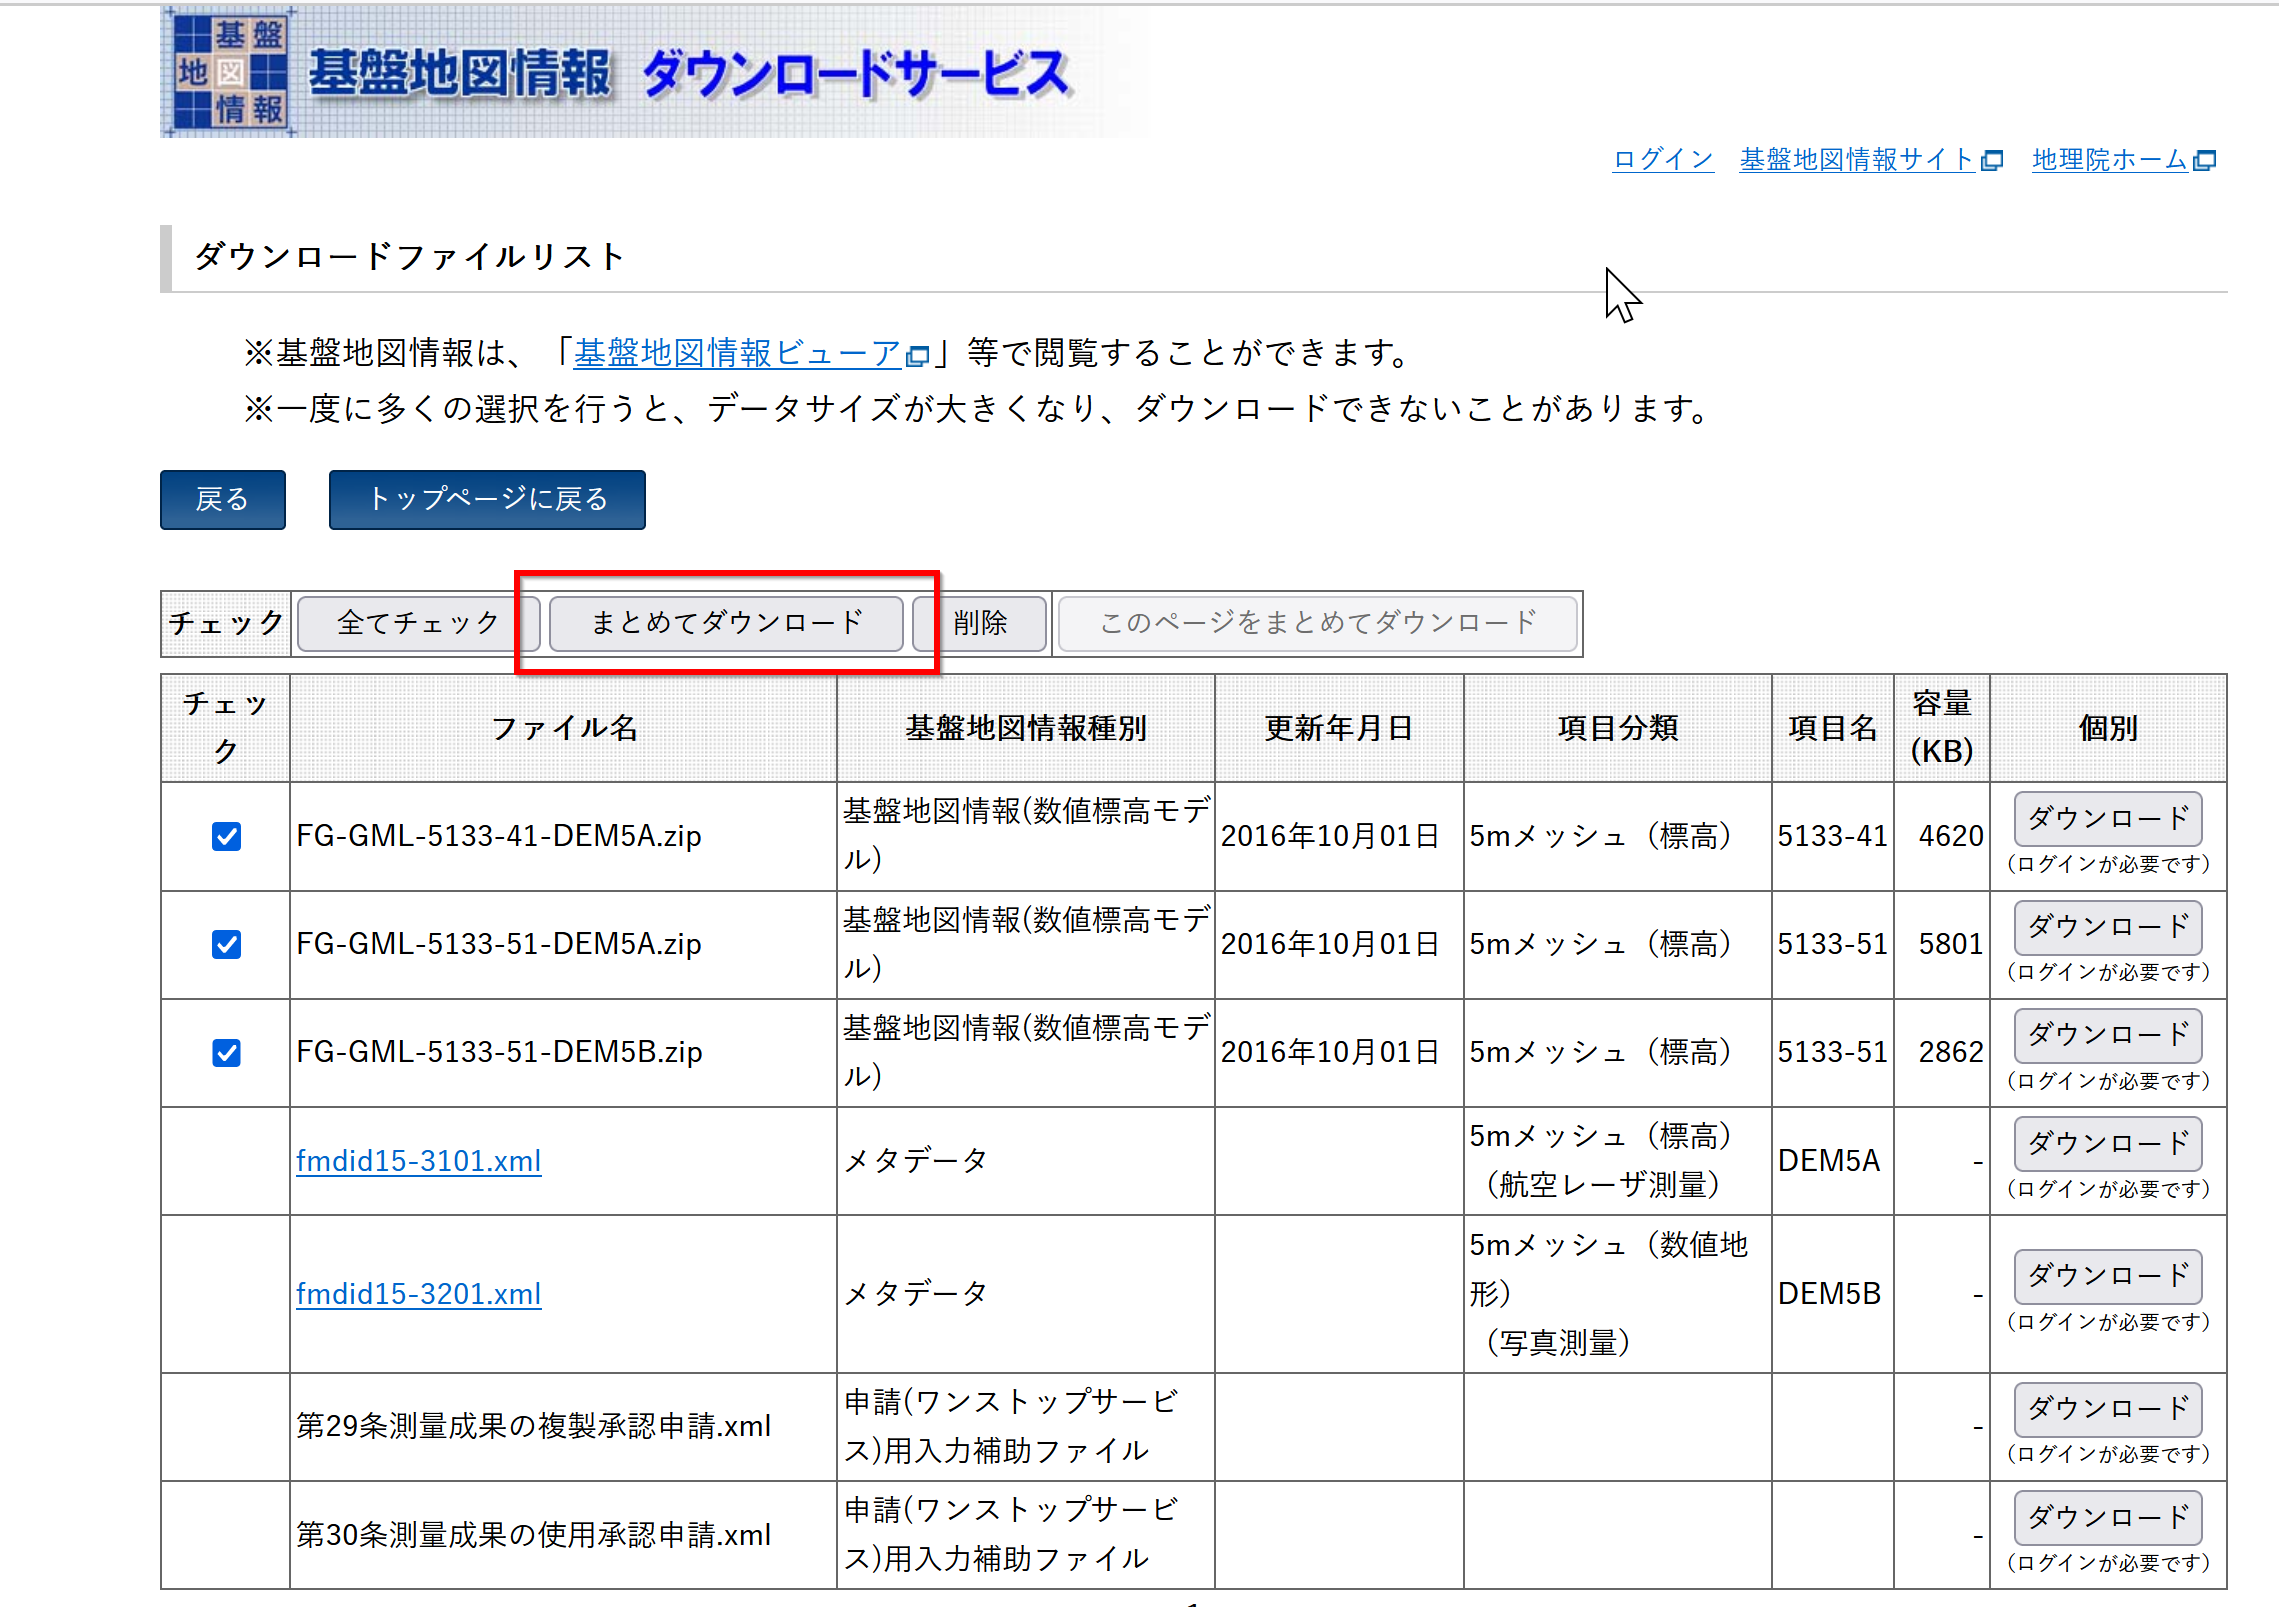
- 「まとめてダウンロード」をクリック
- ログインする
- アンケートに協力する(正しく回答する)
- .zip ファイルのダウンロードが始まるので確認する
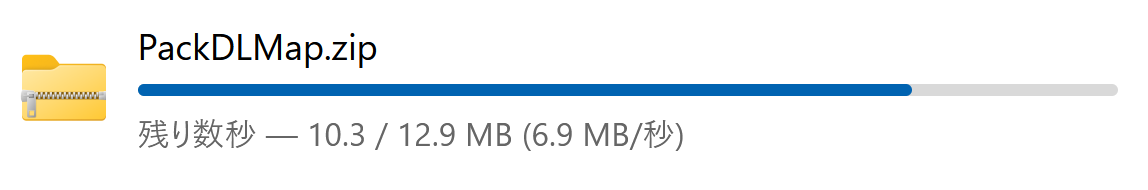
- ダウンロードした .zip ファイルを展開(解凍)する.分かりやすいディレクトリに置く.
※ 展開(解凍)すると .zip ファイルができるので確認する.
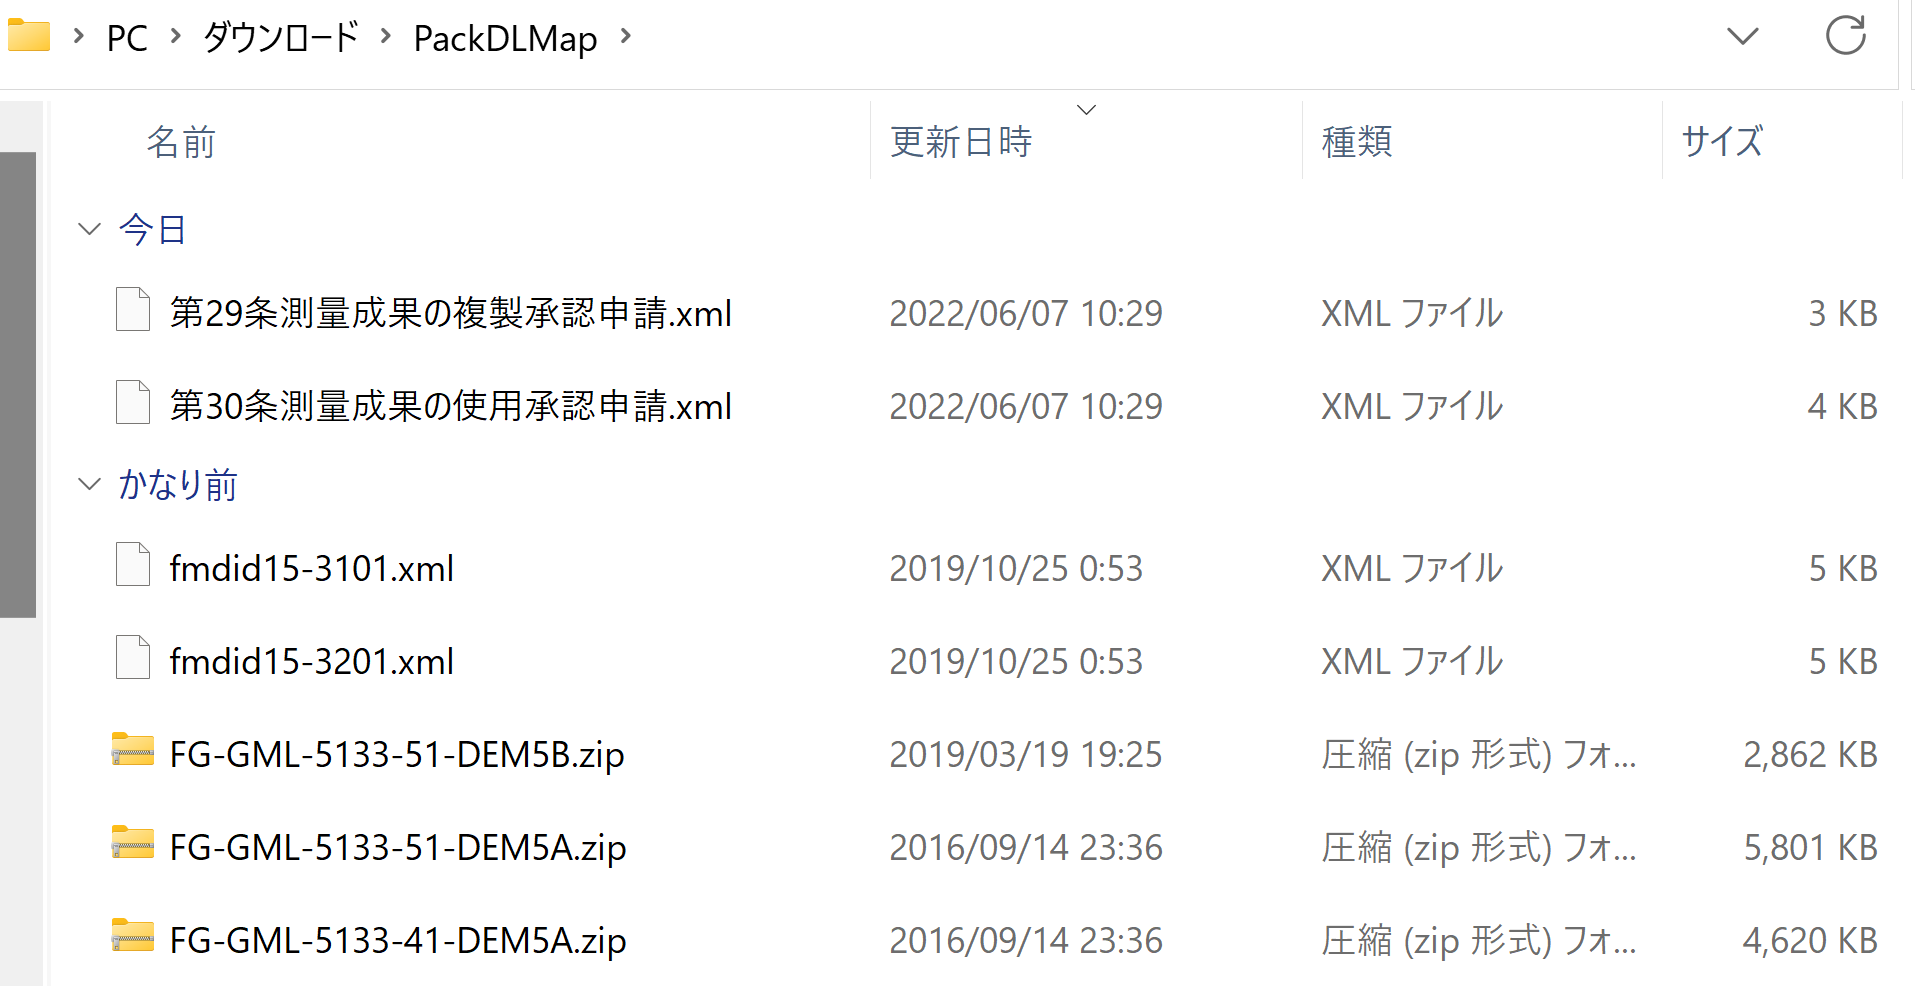
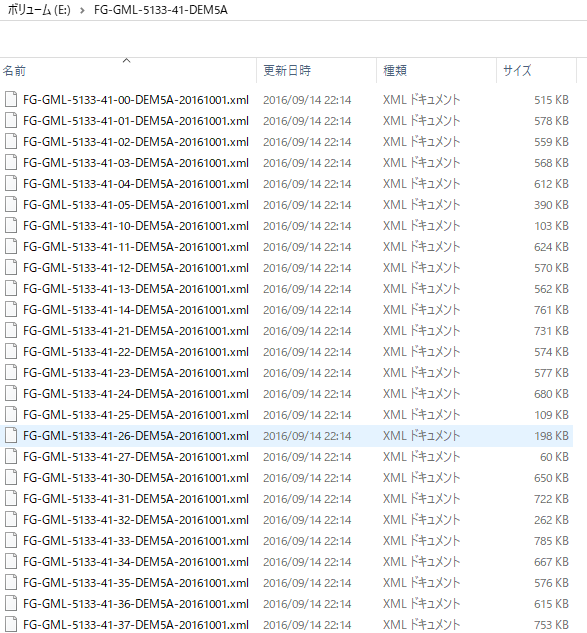
- さらに展開(解凍)すると .xml ファイルができるので確認する.
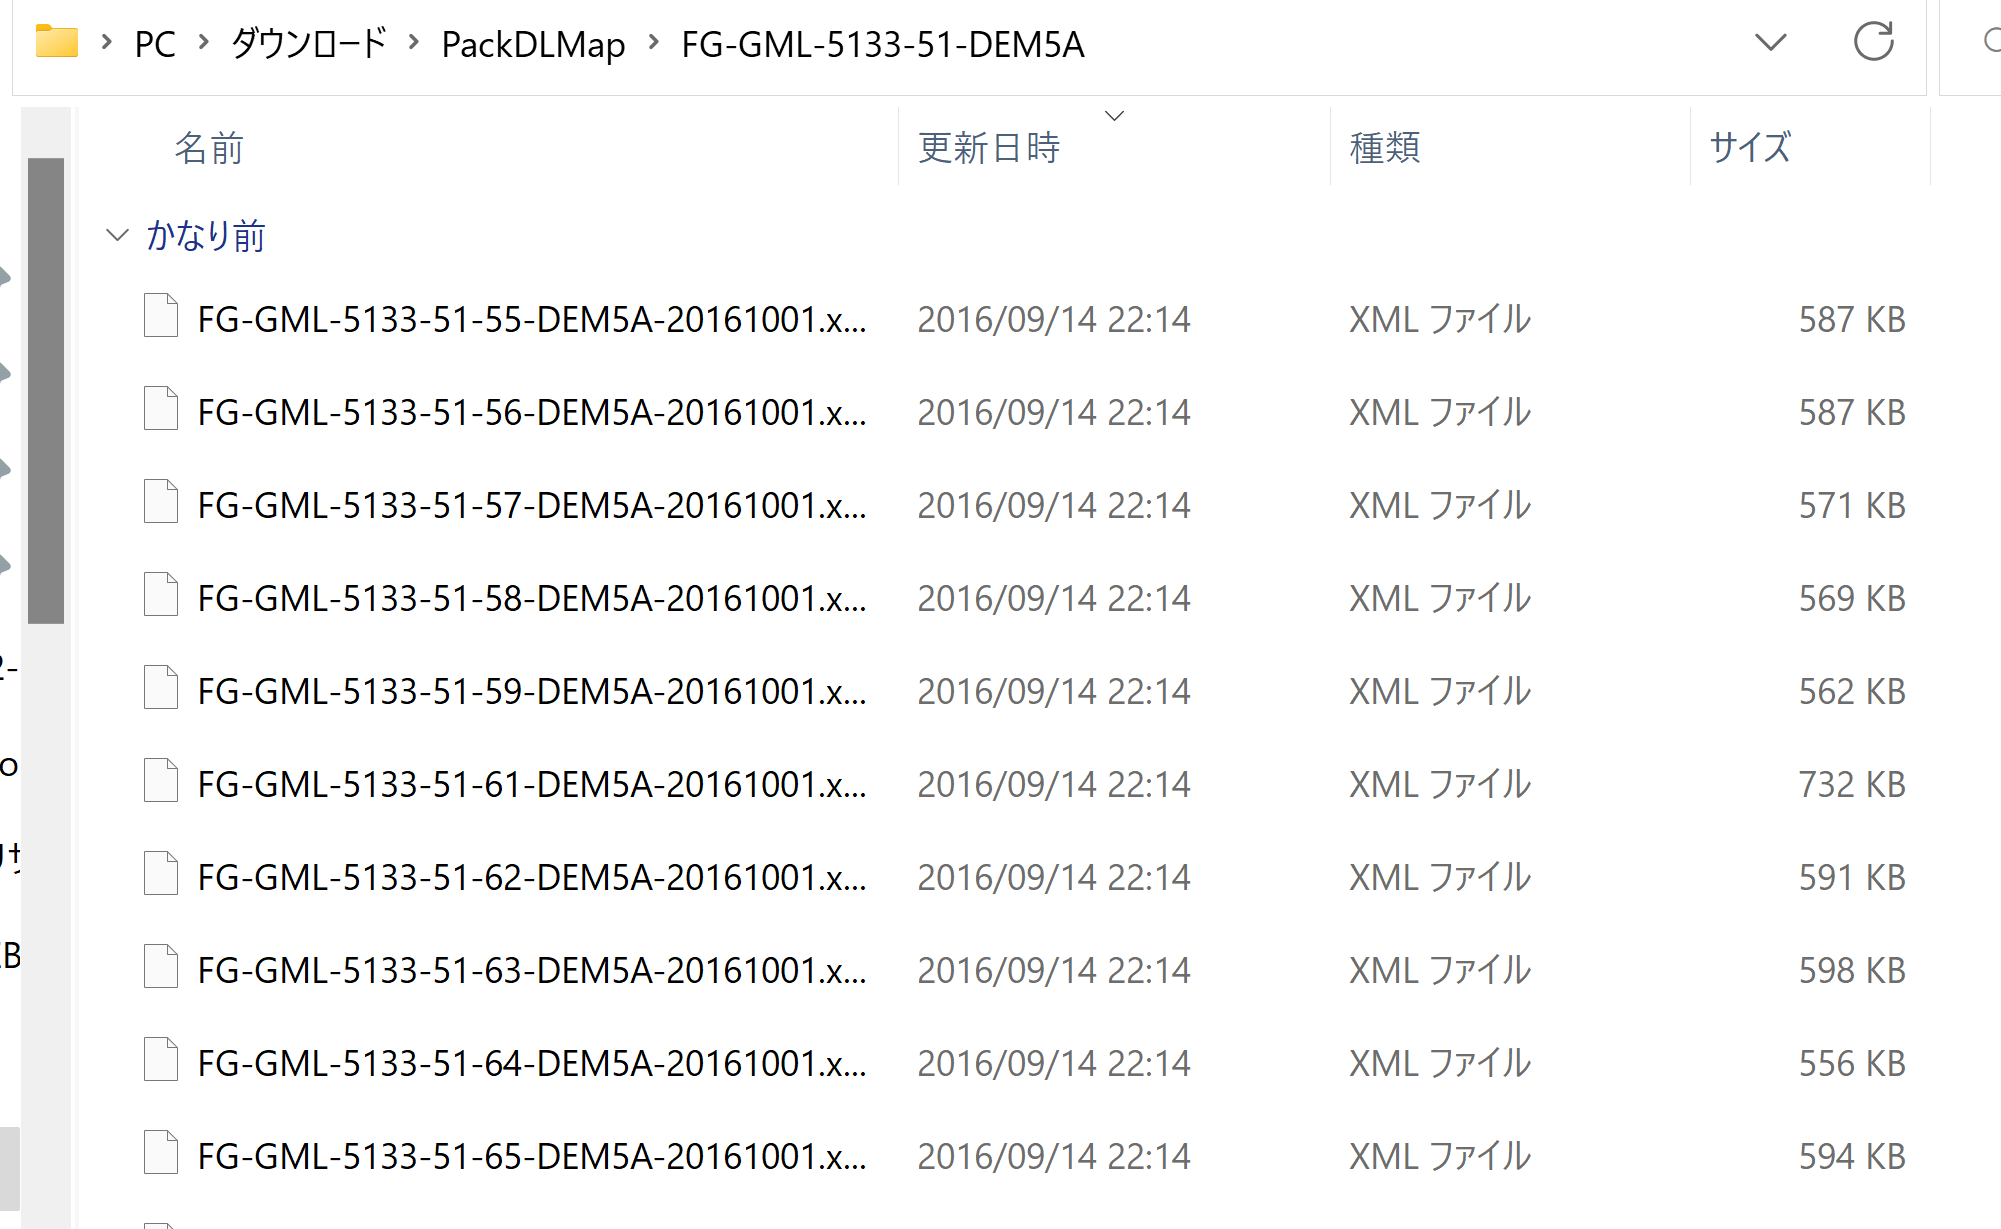
ファイル名: FG_GML-5133-41-00-DEM5A-201601001.xml
- 5133: 1次メッシュ番号
- 41: 2次メッシュ番号
- 00: 3次メッシュ番号
- 5A: 「5A」は航空レーザー測量,「5B」は写真測量.
- 20161001: 年月日
基盤地図情報の数値標高モデルを GeoTIFF に変換
- 「GeoTIFFを格納するフォルダ」を1つ作り,そこに,すべての .xml ファイル を集める.
- http://sanvarie.hatenablog.com/entry/2016/01/10/163027 に記載のプログラムを実行してみる
優れたソフトウェアの公開に感謝を表明します.
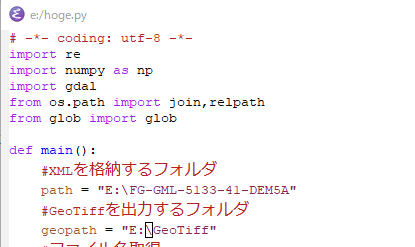
まず,プログラム内のXMLを格納するフォルダ,GeoTIFFを格納するフォルダは適切に設定する必要がある(下図のように).
実行は簡単でした.
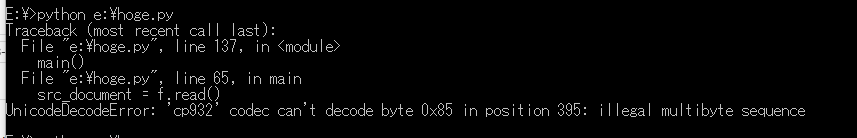
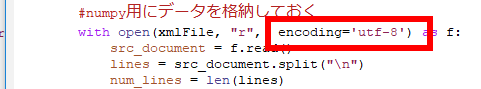
 * Windows で実行するとき,次のようなエラーが出ることがある.
UnicodeDecodeError: 'cp932' codec can't decode byte 0x85 in position 395: illegal multibype sequence.
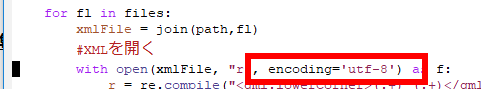
* 次のように,プログラムファイルを書き換えて回避しました(書き換え箇所2か所)
- Windows でファイルを見てみると、つぎのようになります
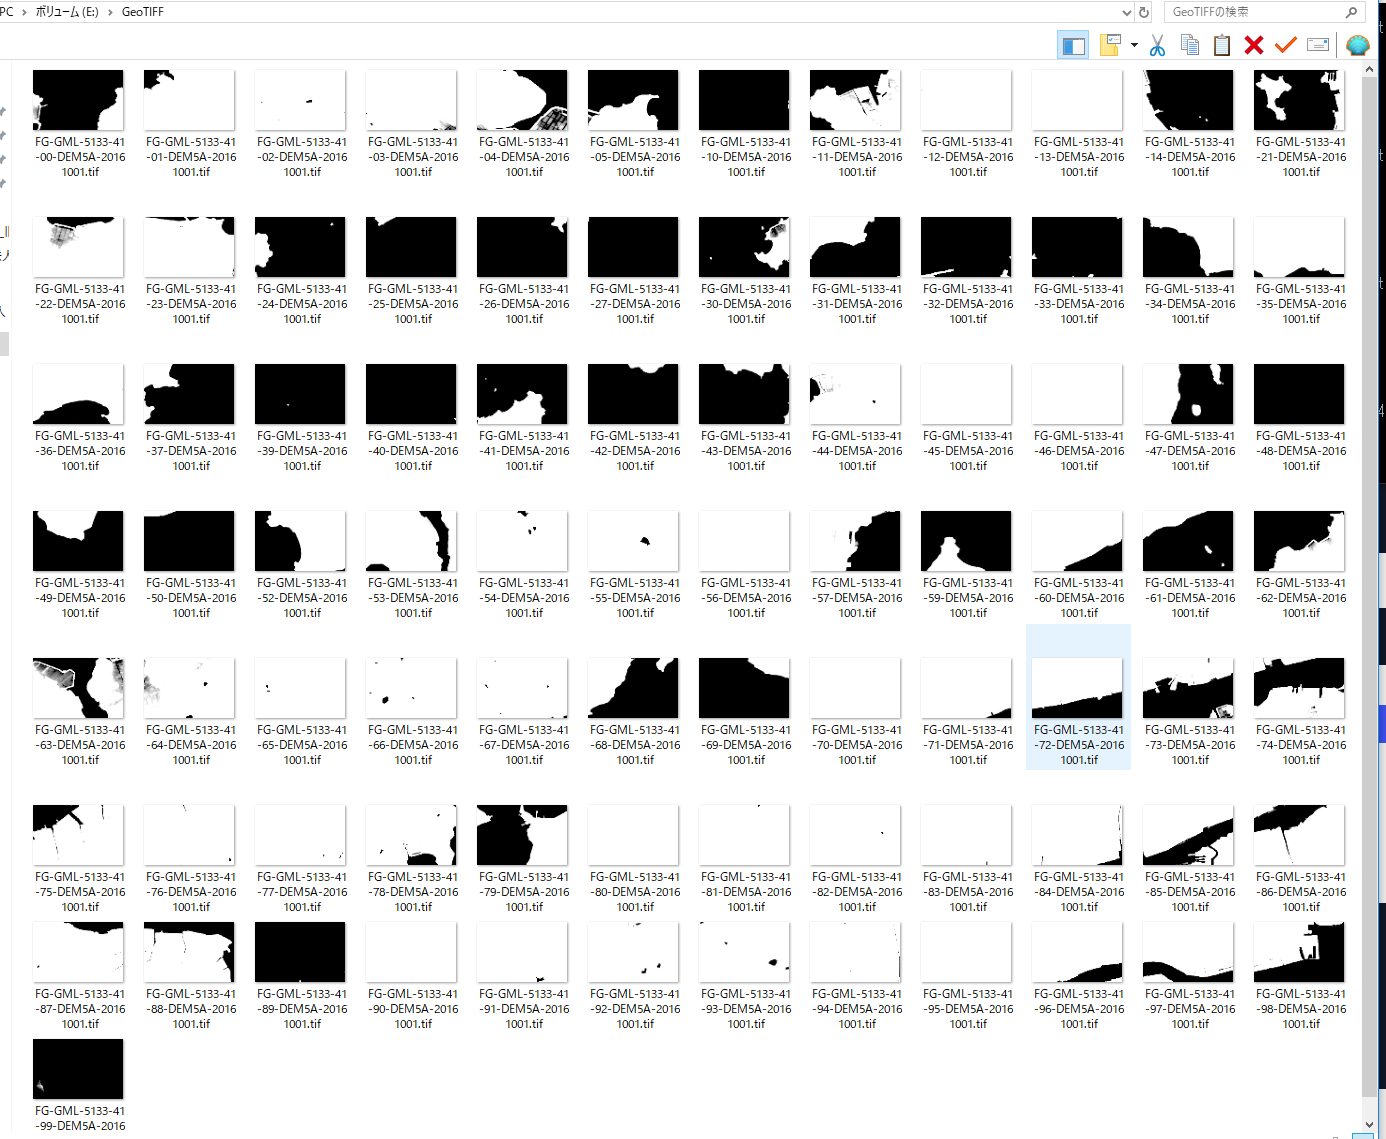
- Windows でファイルを見てみると、つぎのようになります
GeoTIFF ファイルの読み込み
Python で GeoTIFF のデータを読み込む
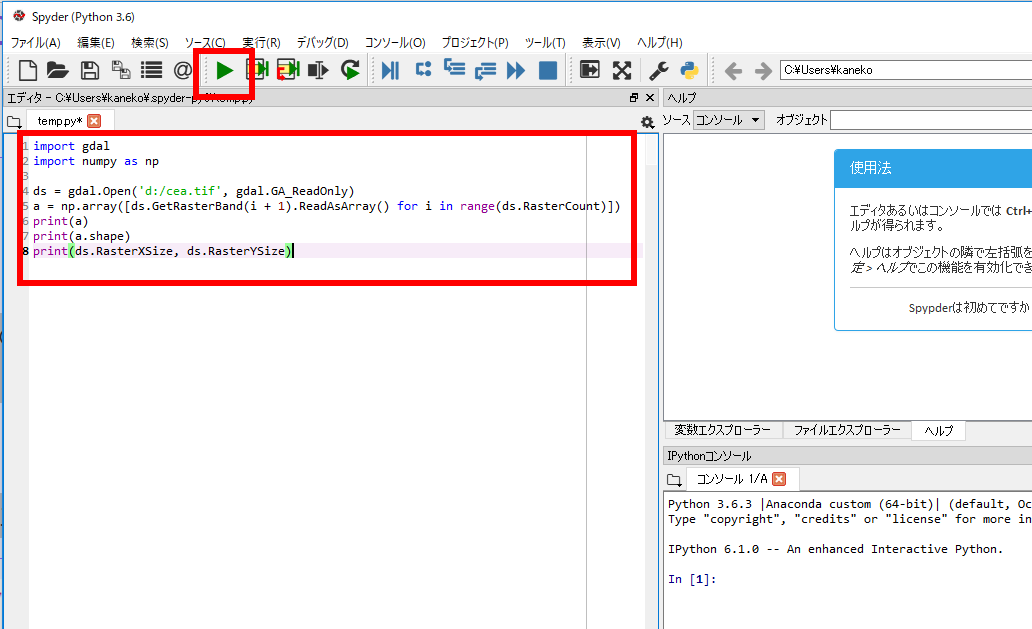
ここでは,GeoTIFF のファイル d:/cea.tif を numpy 形式のオブジェクト a に読み込む.確認のため print コマンドで,a の中身, a の要素数, GeoTIFF の縦横, 画素値の最大値と最小値を表示している
- Python プログラムの実行
import gdal
import numpy as np

ds = gdal.Open('d:/cea.tif', gdal.GA_ReadOnly)
a = np.array([ds.GetRasterBand(i + 1).ReadAsArray() for i in range(ds.RasterCount)])
print(a)
print(a.shape)
print(ds.RasterXSize, ds.RasterYSize)
Python プログラムの編集と実行
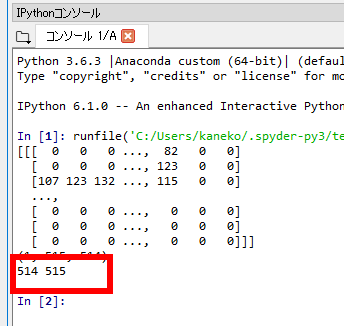
- 実行結果を確認する.
「514 415」は、GeoTIFF の縦横を表示している
- 続いて次のプログラムを実行してみる
「255」や「0」は、画素値の最大値と最小値である.
np.max(a)
np.min(a)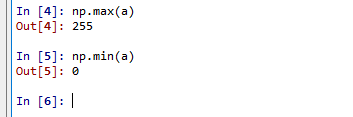
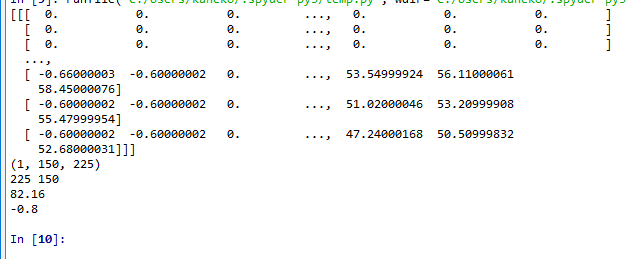
- 念のため別の GeoTIFF ファイル E:/FG-GML-5133-41-DEM5A/51334100.tifで,同じことを繰り返してみる
import gdal
import numpy as np

ds = gdal.Open('E:/FG-GML-5133-41-DEM5A/51334100.tif', gdal.GA_ReadOnly)
a = np.array([ds.GetRasterBand(i + 1).ReadAsArray() for i in range(ds.RasterCount)])
print(a)
print(a.shape)
print(ds.RasterXSize, ds.RasterYSize)
print( np.max(a) )
print( np.min(a) )
そして、実行結果を確認する
GeoTIFF ファイルからの緯度経度の取得
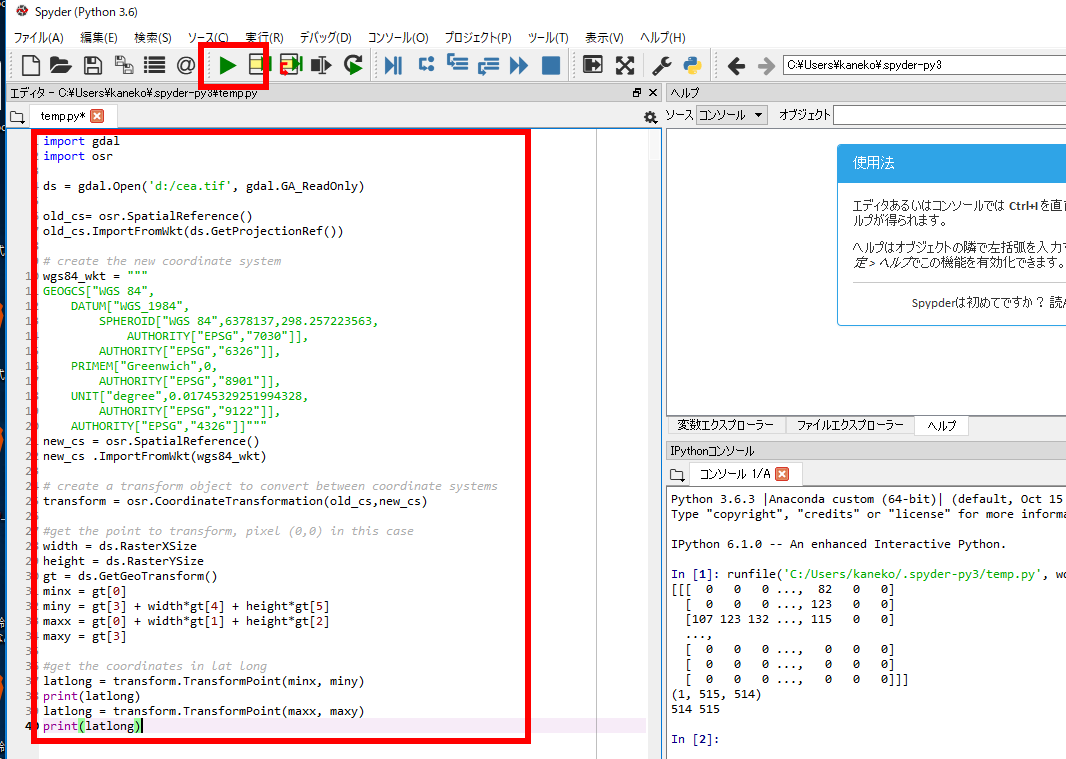
- Python で GeoTIFF の緯度経度を取得
https://stackoverflow.com/questions/2922532/obtain-latitude-and-longitude-from-a-geotiff-file に記載のプログラムを次のように書き換えて使用.(書き換えた部分は太字で示す)。
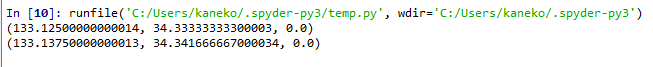
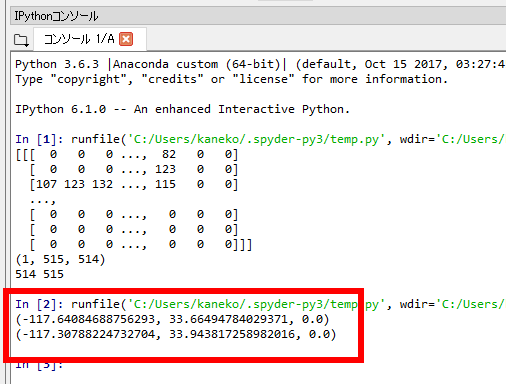
import gdal
import osr

ds = gdal.Open('d:/cea.tif', gdal.GA_ReadOnly)

old_cs= osr.SpatialReference()
old_cs.ImportFromWkt(ds.GetProjectionRef())

# create the new coordinate system
wgs84_wkt = """
GEOGCS["WGS 84",
    DATUM["WGS_1984",
        SPHEROID["WGS 84",6378137,298.257223563,
            AUTHORITY["EPSG","7030"]],
        AUTHORITY["EPSG","6326"]],
    PRIMEM["Greenwich",0,
        AUTHORITY["EPSG","8901"]],
    UNIT["degree",0.01745329251994328,
        AUTHORITY["EPSG","9122"]],
    AUTHORITY["EPSG","4326"]]"""
new_cs = osr.SpatialReference()
new_cs .ImportFromWkt(wgs84_wkt)

# create a transform object to convert between coordinate systems
transform = osr.CoordinateTransformation(old_cs,new_cs)

#get the point to transform, pixel (0,0) in this case
width = ds.RasterXSize
height = ds.RasterYSize
gt = ds.GetGeoTransform()
minx = gt[0]
miny = gt[3] + width*gt[4] + height*gt[5]
maxx = gt[0] + width*gt[1] + height*gt[2]
maxy = gt[3]

#get the coordinates in lat long
latlong = transform.TransformPoint(minx, miny)
print(latlong)
latlong = transform.TransformPoint(maxx, maxy)
print(latlong)
Python プログラムの編集と実行
実行結果の例
- 正しい値なのか確認のため,gdal に付属の gdalinfo コマンドで, .tif ファイルの情報を取得. 先ほどの結果が正しいか確認できる.
太字のところは、実際のディレクトリを調べて読み替えてください
C:\ProgramData\Anaconda3\pkgs\libgdal-2.2.1-vc14_2\Library\bin\gdalinfo.exe d:\cea.tif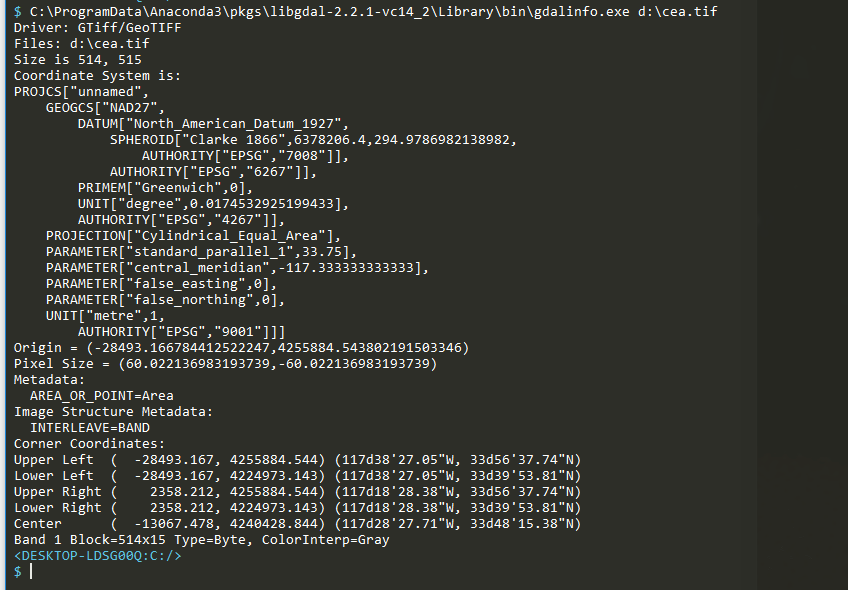
- 念のため別の GeoTIFF ファイル E:/FG-GML-5133-41-DEM5A/51334100.tifで,同じことを繰り返してみる
import gdal
import osr

ds = gdal.Open('E:/FG-GML-5133-41-DEM5A/51334100.tif', gdal.GA_ReadOnly)

old_cs= osr.SpatialReference()
old_cs.ImportFromWkt(ds.GetProjectionRef())

# create the new coordinate system
wgs84_wkt = """
GEOGCS["WGS 84",
    DATUM["WGS_1984",
        SPHEROID["WGS 84",6378137,298.257223563,
            AUTHORITY["EPSG","7030"]],
        AUTHORITY["EPSG","6326"]],
    PRIMEM["Greenwich",0,
        AUTHORITY["EPSG","8901"]],
    UNIT["degree",0.01745329251994328,
        AUTHORITY["EPSG","9122"]],
    AUTHORITY["EPSG","4326"]]"""
new_cs = osr.SpatialReference()
new_cs .ImportFromWkt(wgs84_wkt)

# create a transform object to convert between coordinate systems
transform = osr.CoordinateTransformation(old_cs,new_cs)

#get the point to transform, pixel (0,0) in this case
width = ds.RasterXSize
height = ds.RasterYSize
gt = ds.GetGeoTransform()
minx = gt[0]
miny = gt[3] + width*gt[4] + height*gt[5]
maxx = gt[0] + width*gt[1] + height*gt[2]
maxy = gt[3]

#get the coordinates in lat long
latlong = transform.TransformPoint(minx, miny)
print(latlong)
latlong = transform.TransformPoint(maxx, maxy)
print(latlong)