Dash のインストールと動作確認
1. エグゼクティブサマリー
Dashは,Plotly.jsベースのグラフや表をWebブラウザ上に表示し,ユーザによるインタラクティブな操作を可能にするPythonのWebアプリケーションフレームワークである。
Dashのインストールから動作確認までの手順を示す。基本的な棒グラフの表示,DataTableの定期更新,およびコールバックによるインタラクティブ更新の3つのプログラム例を取り上げる。
- Dash公式サイト: https://dash.plotly.com/
- Dashのインストール: https://www.kkaneko.jp/pro/webui/dash.html
- Flaskのインストール
2. 前準備(必要ソフトウェアの入手)
ここでは、最低限の事前準備について説明する。機械学習や深層学習を行う場合は、NVIDIA CUDA、Visual Studio、Cursorなどを追加でインストールすると便利である。これらについては別ページ https://www.kkaneko.jp/cc/dev/aiassist.htmlで詳しく解説しているので、必要に応じて参照してください。
Python 3.12 のインストール(Windows 上) [クリックして展開]
以下のいずれかの方法で Python 3.12 をインストールする。Python がインストール済みの場合、この手順は不要である。
方法1:winget によるインストール
管理者権限のコマンドプロンプトで以下を実行する。管理者権限のコマンドプロンプトを起動するには、Windows キーまたはスタートメニューから「cmd」と入力し、表示された「コマンドプロンプト」を右クリックして「管理者として実行」を選択する。
winget install --id Python.Python.3.12 -e --scope machine --silent --accept-source-agreements --accept-package-agreements --override "/quiet InstallAllUsers=1 PrependPath=1 Include_test=0 Include_pip=1 Include_launcher=1 InstallLauncherAllUsers=1 TargetDir=\"C:\Program Files\Python312\""
powershell -Command "$p='C:\Program Files\Python312'; $s=\"$p\Scripts\"; $m=[Environment]::GetEnvironmentVariable('Path','Machine'); if($m -notlike \"*$s*\") { [Environment]::SetEnvironmentVariable('Path', \"$p;$s;$m\", 'Machine') }"
--scope machine を指定することで、システム全体(全ユーザー向け)にインストールされる。このオプションの実行には管理者権限が必要である。インストール完了後、コマンドプロンプトを再起動すると PATH が自動的に設定される。
方法2:インストーラーによるインストール
- Python 公式サイト(https://www.python.org/downloads/)にアクセスし、「Download Python 3.x.x」ボタンから Windows 用インストーラーをダウンロードする。
- ダウンロードしたインストーラーを実行する。
- 初期画面の下部に表示される「Add python.exe to PATH」に必ずチェックを入れてから「Customize installation」を選択する。このチェックを入れ忘れると、コマンドプロンプトから
pythonコマンドを実行できない。 - 「Install Python 3.xx for all users」にチェックを入れ、「Install」をクリックする。
インストールの確認
コマンドプロンプトで以下を実行する。
python --versionバージョン番号(例:Python 3.12.x)が表示されればインストール成功である。「'python' は、内部コマンドまたは外部コマンドとして認識されていません。」と表示される場合は、インストールが正常に完了していない。
AIエディタ Windsurf のインストール(Windows 上) [クリックして展開]
Pythonプログラムの編集・実行には、AIエディタの利用を推奨する。ここでは、Windsurfのインストールを説明する。Windsurf がインストール済みの場合、この手順は不要である。
管理者権限のコマンドプロンプトで以下を実行する。管理者権限のコマンドプロンプトを起動するには、Windows キーまたはスタートメニューから「cmd」と入力し、表示された「コマンドプロンプト」を右クリックして「管理者として実行」を選択する。
winget install --scope machine --id Codeium.Windsurf -e --silent --disable-interactivity --force --accept-source-agreements --accept-package-agreements --custom "/SP- /SUPPRESSMSGBOXES /NORESTART /CLOSEAPPLICATIONS /DIR=""C:\Program Files\Windsurf"" /MERGETASKS=!runcode,addtopath,associatewithfiles,!desktopicon"
powershell -Command "$env:Path=[System.Environment]::GetEnvironmentVariable('Path','Machine')+';'+[System.Environment]::GetEnvironmentVariable('Path','User'); windsurf --install-extension MS-CEINTL.vscode-language-pack-ja --force; windsurf --install-extension ms-python.python --force; windsurf --install-extension Codeium.windsurfPyright --force"
--scope machine を指定することで、システム全体(全ユーザー向け)にインストールされる。このオプションの実行には管理者権限が必要である。インストール完了後、コマンドプロンプトを再起動すると PATH が自動的に設定される。
【関連する外部ページ】
Windsurf の公式ページ: https://windsurf.com/
必要なライブラリのインストール [クリックして展開]
管理者権限のコマンドプロンプトで以下を実行する。管理者権限のコマンドプロンプトを起動するには、Windows キーまたはスタートメニューから「cmd」と入力し、表示された「コマンドプロンプト」を右クリックして「管理者として実行」を選択する。
python -m pip install pandas dash dash-daq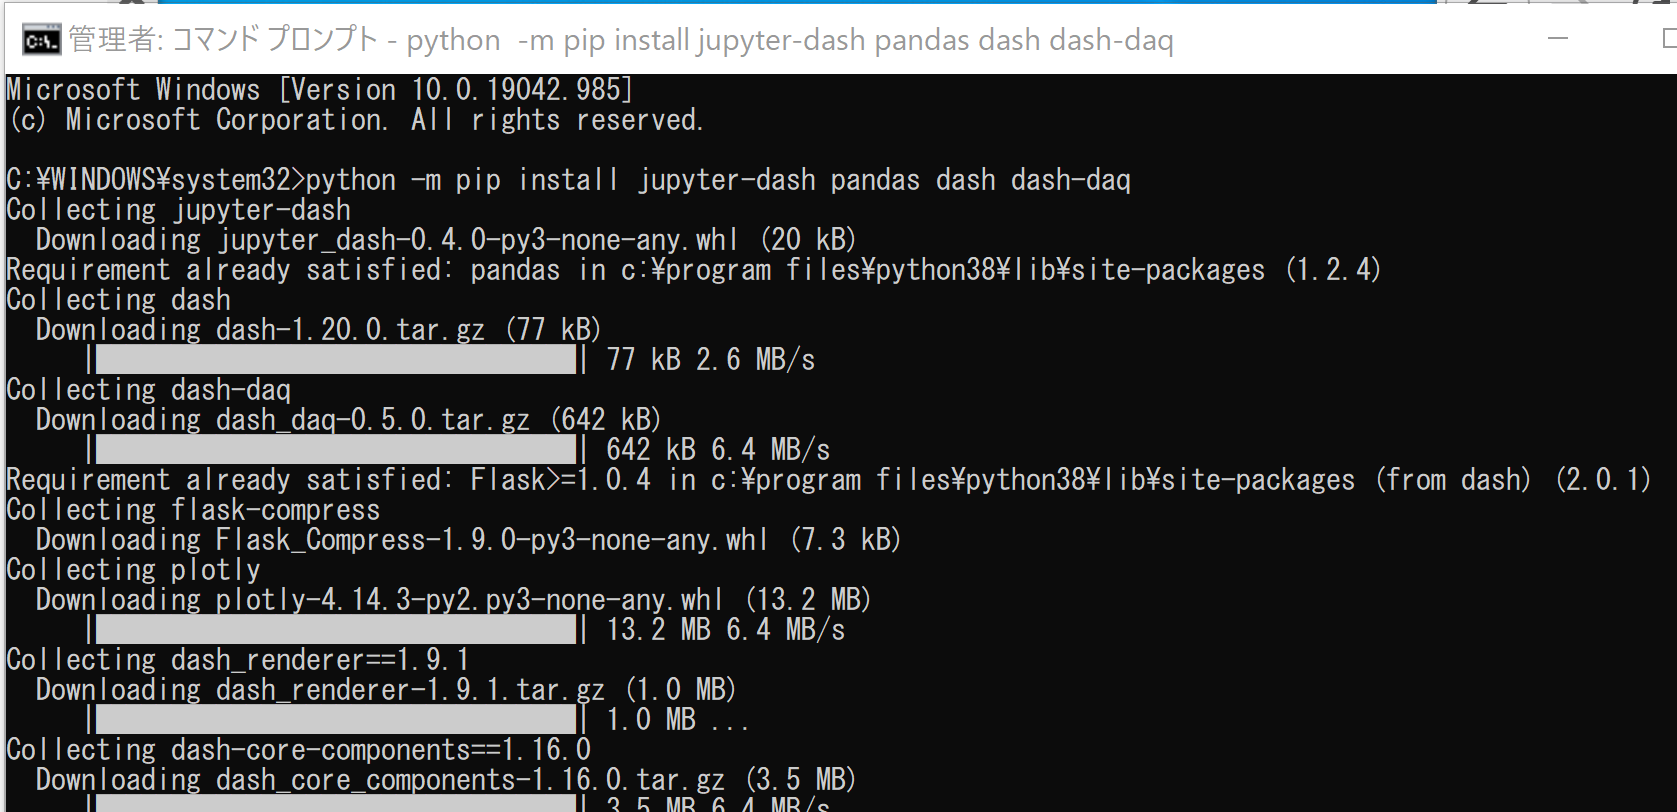
3. 実行のための準備とその確認手順(Windows 前提)
3.1 プログラムファイルの準備
第5章に掲載するソースコードをテキストエディタ(メモ帳等)に貼り付け,hoge.py として保存する(文字コード:UTF-8)。コマンドプロンプトから以下のコマンドでメモ帳を起動してファイルを作成することもできる。
cd /d c:%HOMEPATH%
notepad hoge.py
3.2 実行コマンド
コマンドプロンプトでファイルの保存先ディレクトリに移動し,以下を実行する。
python hoge.py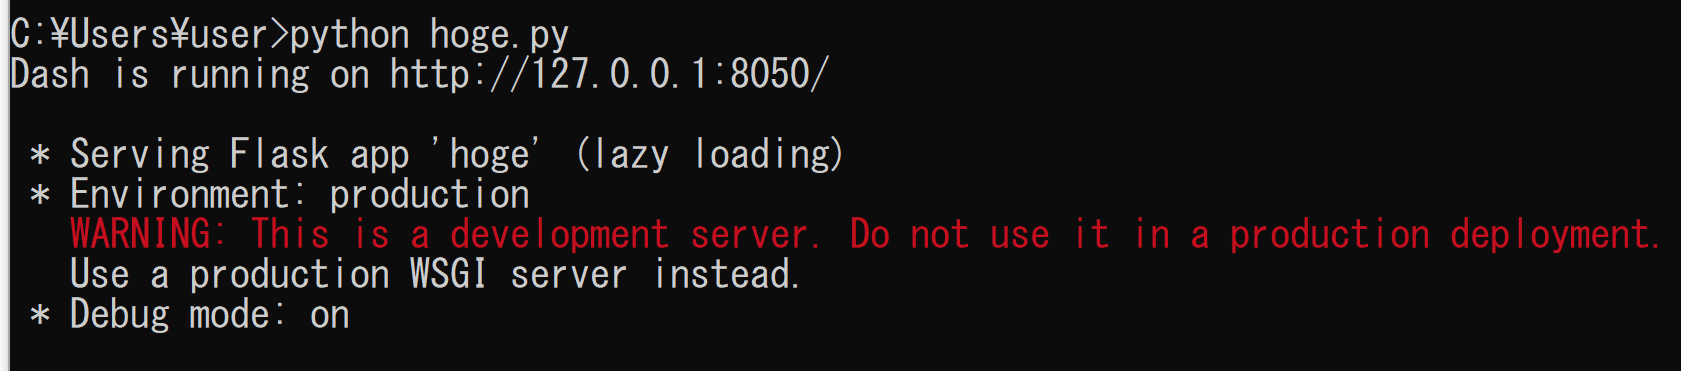
3.3 動作確認チェックリスト
| 確認項目 | 期待される結果 |
|---|---|
python hoge.py を実行 | 開発サーバが起動し,コマンドプロンプトにURLが表示される |
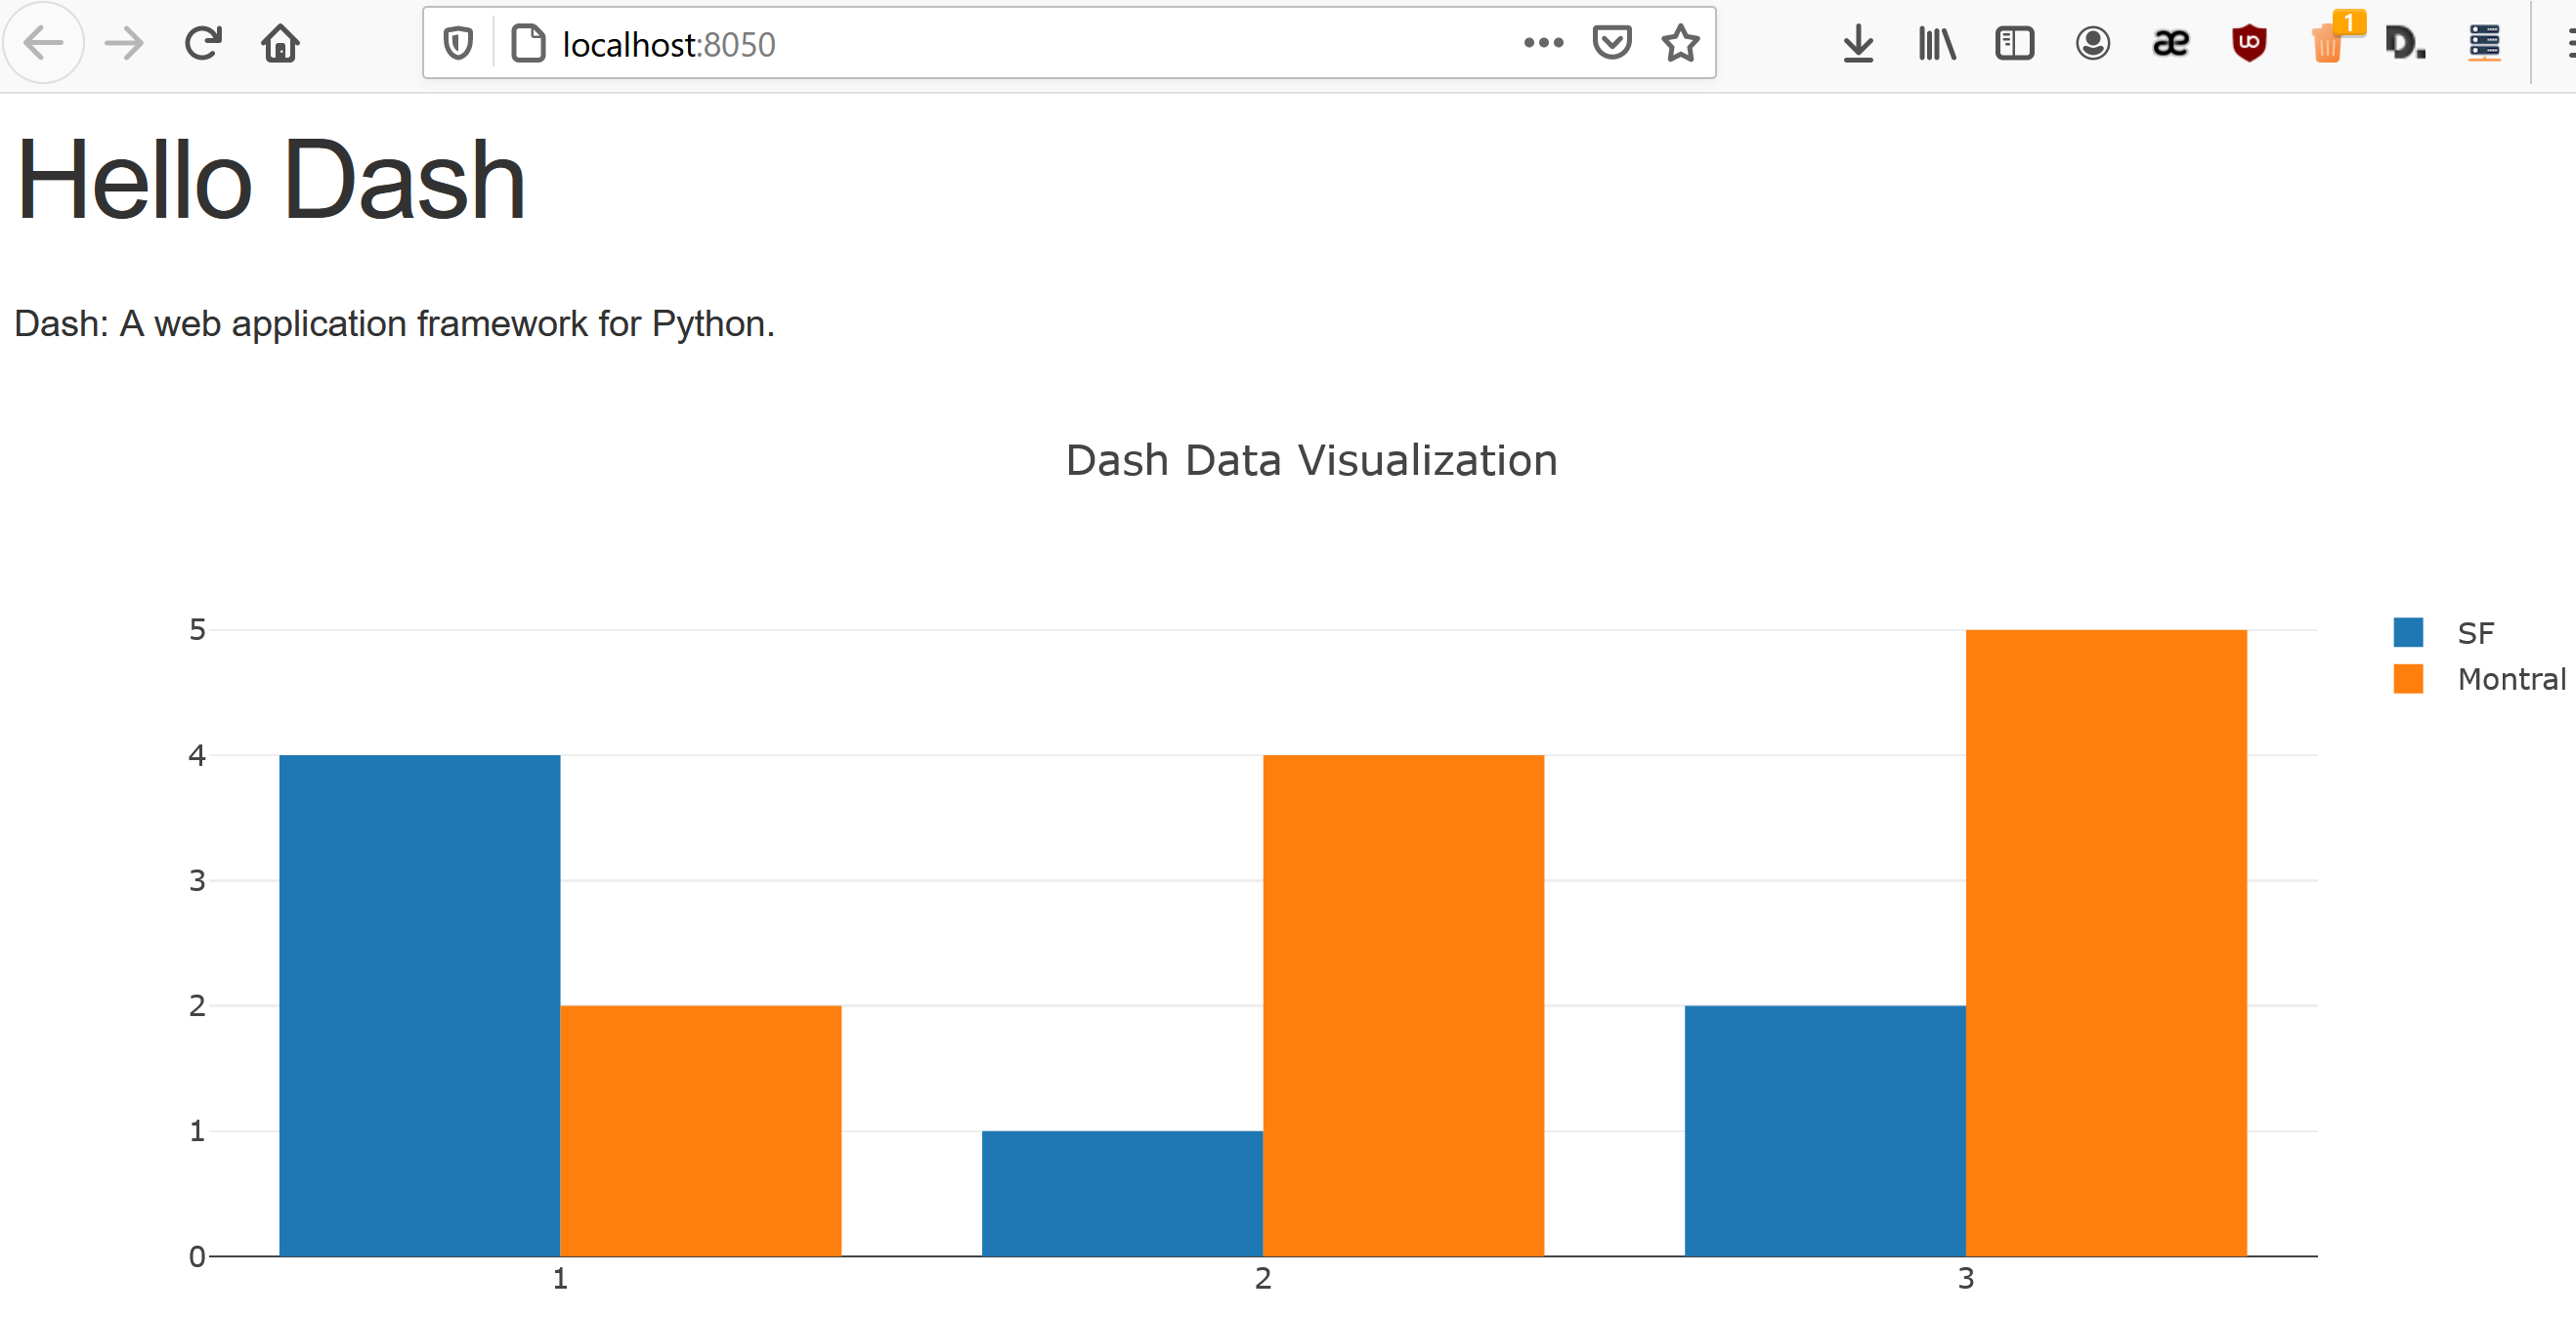
Webブラウザで http://localhost:8050 にアクセス | 「Hello Dash」の見出しと棒グラフが表示される |
| 定期更新プログラムを実行 | DataTableの値が定期的に更新される |
| コールバックプログラムでドロップダウンを操作 | 選択した都市に応じて棒グラフが切り替わる |
4. 概要・使い方・実行上の注意
動作確認プログラム(hoge.py)
棒グラフを表示する基本的なDashアプリケーションである。dcc.Graph コンポーネントにデータとレイアウトを辞書形式で渡すことで,SFとMontréalの2系列の棒グラフを描画する。ソースコードは第5章に掲載している。
定期更新プログラム
Dashのレイアウトを定期的に更新するプログラムである。ソースコードは第5章に掲載している。
- worker関数が定期的に実行され,DataFrameの値を更新し,do_layout()を呼び出してapp.layoutを更新する。
- worker関数を定期的に実行するために,mainloopをマルチスレッドで実行する。
注意点: app.run()ではdebug=Falseを指定する必要がある。
コールバックによるインタラクティブ更新
Dashのコールバック機能により,ユーザの操作に応じてグラフを動的に更新できる。ドロップダウンメニューで選択したデータ系列を棒グラフに表示する。ソースコードは第5章に掲載している。
5. ソースコード
動作確認プログラム(hoge.py)
# -*- coding: utf-8 -*-
from dash import Dash, dcc, html

external_stylesheets = ['https://codepen.io/chriddyp/pen/bWLwgP.css']

app = Dash(__name__, external_stylesheets=external_stylesheets)

app.layout = html.Div(children=[
    html.H1(children='Hello Dash'),

    html.Div(children='''
        Dash: A web application framework for Python.
    '''),

    dcc.Graph(
        id='example-graph',
        figure={
            'data': [
                {'x': [1, 2, 3], 'y': [4, 1, 2], 'type': 'bar', 'name': 'SF'},
                {'x': [1, 2, 3], 'y': [2, 4, 5], 'type': 'bar', 'name': 'Montréal'},
            ],
            'layout': {
                'title': 'Dash Data Visualization'
            }
        }
    )
])

if __name__ == '__main__':
    app.run(debug=True)
定期更新プログラム
# -*- coding: utf-8 -*-
from dash import Dash, dash_table, html
import pandas as pd
import time
import threading

external_stylesheets = ['https://codepen.io/chriddyp/pen/bWLwgP.css']

app = Dash(__name__, external_stylesheets=external_stylesheets)

X = pd.DataFrame([[1, 2, 3], [4, 1, 2]])

def do_layout():
    app.layout = html.Div(children=[
        html.H1(children='Hello Dash'),
        html.Div(children='Dash: A web application framework for Python.'),
        dash_table.DataTable(
            id='table',
            columns=[{"name": str(i), "id": str(i)} for i in X.columns],
            data=X.to_dict("records")
        )
    ])

def worker():
    do_layout()
    X.iloc[0, 0] = X.iloc[0, 0] + 1

def mainloop():
    time_interval = 5
    while True:
        t = threading.Thread(target=worker)
        t.start()
        t.join()
        time.sleep(time_interval)

if __name__ == '__main__':
    t0 = threading.Thread(target=mainloop)
    t0.start()
    app.run(debug=False)
コールバックによるインタラクティブ更新
# -*- coding: utf-8 -*-
from dash import Dash, dcc, html, Input, Output

external_stylesheets = ['https://codepen.io/chriddyp/pen/bWLwgP.css']

app = Dash(__name__, external_stylesheets=external_stylesheets)

data = {
    'SF': {'x': [1, 2, 3], 'y': [4, 1, 2]},
    'Montréal': {'x': [1, 2, 3], 'y': [2, 4, 5]},
    'Tokyo': {'x': [1, 2, 3], 'y': [3, 3, 4]},
}

app.layout = html.Div([
    dcc.Dropdown(
        id='city-dropdown',
        options=[{'label': c, 'value': c} for c in data],
        value='SF'
    ),
    dcc.Graph(id='city-graph')
])

@app.callback(Output('city-graph', 'figure'), Input('city-dropdown', 'value'))
def update_graph(city):
    d = data[city]
    return {'data': [{'x': d['x'], 'y': d['y'], 'type': 'bar', 'name': city}],
            'layout': {'title': city}}

if __name__ == '__main__':
    app.run(debug=True)
6. まとめ
Dashフレームワーク
Dashは,Plotly.jsベースのグラフや表をWebブラウザ上に表示し,ユーザによるインタラクティブな操作を可能にするPythonのWebアプリケーションフレームワークである。
インストール
Pythonがインストールされた環境で,python -m pip install pandas dash dash-daq を実行することで必要なライブラリが導入される。
動作確認
プログラム実行後,Webブラウザで http://localhost:8050 にアクセスすることで動作を確認できる。
定期更新とマルチスレッド
Dashのレイアウトを定期的に更新するには,worker関数をマルチスレッドで実行する。この場合,app.run()ではdebug=Falseを指定する必要がある。
コールバックによるインタラクティブ更新
Dashのコールバック機能により,ユーザの操作に応じてグラフを動的に更新できる。ドロップダウンメニュー等のコンポーネントとグラフを連動させることで,インタラクティブなデータ可視化を実現できる。