データの並び x, y を3本の線分で近似
keyphrase: Fitting a piecewise linear function
前準備
Python の準備(Windows,Ubuntu 上)
- Windows での Python 3.10,関連パッケージ,Python 開発環境のインストール(winget を使用しないインストール): 別ページ »で説明
- Ubuntu では,システム Pythonを使うことができる.Python3 開発用ファイル,pip, setuptools のインストール: 別ページ »で説明
【サイト内の関連ページ】
- Python のまとめ: 別ページ »にまとめ
- Google Colaboratory の使い方など: 別ページ »で説明
【関連する外部ページ】 Python の公式ページ: https://www.python.org/
Python の公式ページ: https://www.python.org/
3本の線分で x, y データを近似するプログラム
# 3本の線分で x, y を近似
from scipy import optimize
%matplotlib inline
import matplotlib.pyplot as plt
import warnings
warnings.filterwarnings('ignore') # Suppress Matplotlib warnings
import numpy as np
x = np.array([1, 2, 3, 4, 5, 6, 7, 8, 9, 10 ,11, 12, 13, 14, 15], dtype=float)
y = np.array([22, 16, 10, 4, 4, 4, 4, 4, 4, 4, 24, 44, 64, 84, 104])
# 3本の線分で x, y を近似
# i は最初の端点(添字。添え字は0から始まる数字)
residuals = np.ones((x.shape[0]-2, x.shape[0]-1)) * 1e+16
for i in np.arange(1, x.shape[0] - 2):
seg1_x = x[0:i + 1]
seg1_y = y[0:i + 1]
# y = ax + b で近似
coef1, residuals1, rank1, singular_values1, th1 = np.polyfit(seg1_x, seg1_y, 1, full=True)
a1 = coef1[0]
b1 = coef1[1]
# j は2番目の端点(添字。添え字は0から始まる数字)
for j in np.arange(i + 1, x.shape[0] - 1):
# print(i, j)
seg2_x = x[i:j + 1]
seg2_y = y[i:j + 1]
seg3_x = x[j:x.shape[0]]
seg3_y = y[j:x.shape[0]]
coef2, residuals2, rank2, singular_values2, th2 = np.polyfit(seg2_x, seg2_y, 1, full=True)
a2 = coef2[0]
b2 = coef2[1]
coef3, residuals3, rank3, singular_values3, th3 = np.polyfit(seg3_x, seg3_y, 1, full=True)
a3 = coef3[0]
b3 = coef3[1]
# 確認表示
# plt.plot(seg1_x, np.poly1d(np.polyfit(seg1_x, seg1_y, 1))(seg1_x))
# plt.plot(seg2_x, np.poly1d(np.polyfit(seg2_x, seg2_y, 1))(seg2_x))
# plt.plot(seg3_x, np.poly1d(np.polyfit(seg3_x, seg3_y, 1))(seg3_x))
residuals[i, j] = sum(residuals1) + sum(residuals2) + sum(residuals3)
# 確認表示
# from mpl_toolkits.mplot3d import Axes3D
# fig = plt.figure()
# ax = Axes3D(fig)
# ii = np.arange(0,residuals.shape[0])
# jj = np.arange(0,residuals.shape[1])
# XX, YY = np.meshgrid(jj, ii)
# ax.plot_wireframe(XX, YY, residuals)
i, j = np.unravel_index(np.argmin(residuals), residuals.shape)
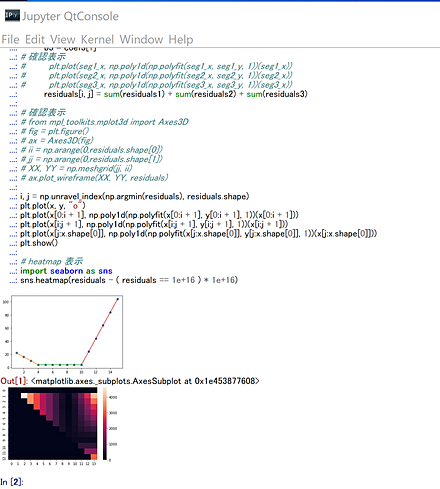
plt.plot(x, y, "o")
plt.plot(x[0:i + 1], np.poly1d(np.polyfit(x[0:i + 1], y[0:i + 1], 1))(x[0:i + 1]))
plt.plot(x[i:j + 1], np.poly1d(np.polyfit(x[i:j + 1], y[i:j + 1], 1))(x[i:j + 1]))
plt.plot(x[j:x.shape[0]], np.poly1d(np.polyfit(x[j:x.shape[0]], y[j:x.shape[0]], 1))(x[j:x.shape[0]]))
plt.show()
# heatmap 表示
import seaborn as sns
sns.heatmap(residuals - ( residuals == 1e+16 ) * 1e+16)