huagrahuma.dem (topmodel パッケージ) データの紹介
このページでは,
- huagrahuma, huagrahuma.dem データセット
を使います
前準備
使用するソフトウェア
- R システムのインストールが済んでいること
huagrahuma, huagrahuma.dem データセット
ggplot 関数を用いた表示 (例)
【関連する外部ページ】 http://zoas.blog112.fc2.com/blog-entry-1.html
require(ggplot2)
require(topmodel)
require(data.table)
data(huagrahuma)
data(huagrahuma.dem)
plotdem <- function(DEM, c) {
x <- rep(1:nrow(DEM), ncol(DEM)) # 1 2 3 1 2 3 1 2 3 1 2 3
y <- rep(1:ncol(DEM), each=nrow(DEM)) # 1 1 1 1 2 2 2 2 3 3 3 3
T <- data.table(x=x, y=y, val=as.numeric(DEM))
ggplot(T, aes(x=x, y=y, fill=val)) + geom_tile() + scale_fill_gradientn("frequency", colours = c)
}
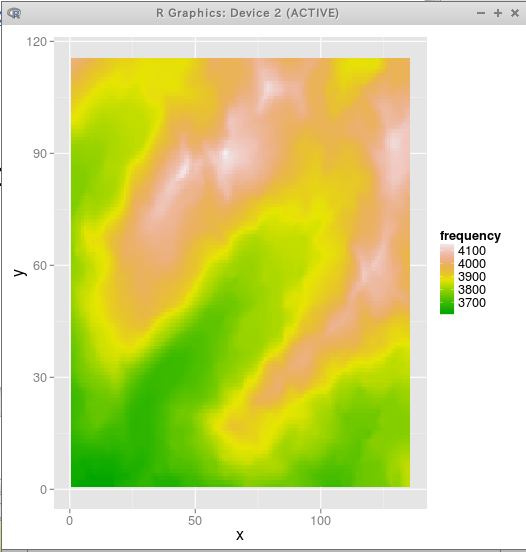
plotdem(huagrahuma.dem, terrain.colors(20))
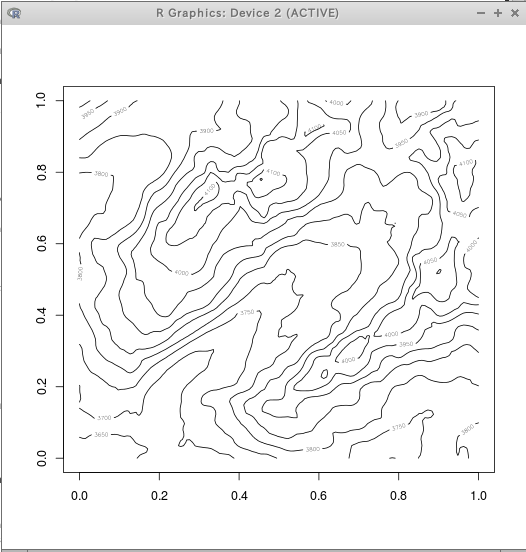
contour(huagrahuma.dem)
◆ plotdem(huagrahuma.dem, terrain.colors(20))
◆ contour(huagrahuma.dem)