データの並び x, y を3本の線分で近似
【概要】
データの並び x, y を3本の線分で近似するプログラムを扱う。この手法は区分線形関数(piecewise linear function。データの区間ごとに別々の1次関数で表す関数)のフィッティングと呼ばれ,データ点列を3つの区間に分割し,各区間で1次関数による最小二乗近似を行い,残差の総和が最小となる分割位置を探索する。
プログラムは Python で実装する。NumPy の多項式近似と総当たり探索により,最適な2つの端点(区間の境界)を決定する。各線分の傾きと切片,端点座標をコンソールに表示し,散布図上に3本の近似線分を描画する。さらに,残差の分布をヒートマップとして可視化する。
keyphrase: Fitting a piecewise linear function
【目次】
【関連する外部ページ】
【サイト内の関連情報】
1. 前準備
Python 3.12 のインストール
Pythonのインストールを行い、Pythonのプログラムを実行する環境を整える。扱う環境は、Windows搭載パソコンである。金子研究室では、Python 3.12.10を推奨する。
[Windows での Python 3.12 のインストール手順を見るには、ここをクリック]
Windows での Python 3.12 のインストール
以下のいずれかの方法でPython 3.12をインストールする。Pythonがインストール済みの場合、この手順は不要である。
方法 1:winget によるインストール
【インストールコマンドの実行方法】
管理者権限でコマンドプロンプトを起動する(手順:Windowsキーまたはスタートメニュー → cmd と入力 → 右クリック → 「管理者として実行」)。そして、コマンド全体をコマンドプロンプトにコピー&ペーストする。
--scope machine を指定することで、システム全体(全ユーザー向け)にインストールされる。このオプションの実行には管理者権限が必要である。インストール完了後、コマンドプロンプトを再起動するとPATHが反映される。
REM Python 3.12 をシステム領域にインストール
winget install --id Python.Python.3.12 -e --scope machine --silent --accept-source-agreements --accept-package-agreements --override "/quiet InstallAllUsers=1 PrependPath=1 Include_test=0 Include_pip=1 Include_launcher=1 InstallLauncherAllUsers=1 TargetDir=\"C:\Program Files\Python312\""

REM Python と Scripts を PATH 先頭に追加
powershell -NoProfile -Command "$p='C:\Program Files\Python312'; $s=\"$p\Scripts\"; $c=[Environment]::GetEnvironmentVariable('Path','Machine'); if((Test-Path $p) -and (';'+$c+';' -notlike \"*;$p;*\") -and (';'+$c+';' -notlike \"*;$s;*\")){[Environment]::SetEnvironmentVariable('Path',\"$p;$s;$c\",'Machine')}"
方法 2:インストーラーによるインストール
- Python公式サイト(https://www.python.org/downloads/)にアクセスし、「Download Python 3.x.x」ボタンからWindows用インストーラーをダウンロードする。
- ダウンロードしたインストーラーを実行する。
- 初期画面の下部に表示される「Add python.exe to PATH」にチェックを入れてから「Customize installation」を選択する。このチェックを入れ忘れると、コマンドプロンプトから
pythonコマンドを実行できない。 - 「Install Python 3.xx for all users」にチェックを入れ、「Install」をクリックする。
インストールの確認
コマンドプロンプトで以下を実行する。
python --versionバージョン番号(例:Python 3.12.x)が表示されればインストール成功である。「'python' は、内部コマンドまたは外部コマンドとして認識されていません。」と表示される場合は、インストールが正常に完了していない。
Python の開発環境 Visual Studio Code のインストールと Python 用の設定
Python の開発環境Visual Studio Code(プログラムを編集するソフトウェア。以下、VS Code)を整える。
[Windows での Visual Studio Code のインストールと Python 用の設定手順を見るには、ここをクリック]
Windows での Visual Studio Code のインストールと Python 用の設定手順
1. VS Code と拡張機能のインストール
以下のコマンドにより,既存の VS Code を削除し,全ユーザー共有の設定で再インストールしたうえで,拡張機能(VS Code に機能を追加するソフトウェア)をまとめて導入する.
【インストールコマンドの実行方法】
管理者権限でコマンドプロンプトを起動する(手順:Windows キーまたはスタートメニュー → cmd と入力 → 右クリック → 「管理者として実行」)。そして,コマンド全体をコマンドプロンプトにコピー&ペーストする。
インストールコマンド
REM ============================================================
REM Microsoft Visual Studio Code
REM ============================================================
winget uninstall -e --id Microsoft.VisualStudioCode --silent --disable-interactivity --accept-source-agreements
rmdir /s /q C:\ProgramData\vscode-extensions 2>nul
rmdir /s /q "%APPDATA%\Code" 2>nul
rmdir /s /q "%USERPROFILE%\.vscode" 2>nul
rmdir /s /q "%LOCALAPPDATA%\Microsoft\vscode-update" 2>nul

REM VS Code をシステム領域に新規インストール
winget install --scope machine --id Microsoft.VisualStudioCode -e --silent --accept-source-agreements --accept-package-agreements

REM 全ユーザー共有の拡張機能フォルダ
mkdir C:\ProgramData\vscode-extensions 2>nul
icacls "C:\ProgramData\vscode-extensions" /grant "Everyone:(OI)(CI)M" /T

REM スタートメニューのショートカットを --extensions-dir 付きで再作成
rmdir /s /q "C:\ProgramData\Microsoft\Windows\Start Menu\Programs\Visual Studio Code" 2>nul
del "C:\ProgramData\Microsoft\Windows\Start Menu\Programs\Visual Studio Code.lnk" 2>nul
powershell -NoProfile -Command "$s=New-Object -ComObject WScript.Shell; $lnk=$s.CreateShortcut('C:\ProgramData\Microsoft\Windows\Start Menu\Programs\Visual Studio Code.lnk'); $lnk.TargetPath='C:\Program Files\Microsoft VS Code\Code.exe'; $lnk.Arguments='--extensions-dir \"C:\ProgramData\vscode-extensions\"'; $lnk.Save()"
REM ショートカットの検証
powershell -NoProfile -Command "$s=New-Object -ComObject WScript.Shell; $lnk=$s.CreateShortcut('C:\ProgramData\Microsoft\Windows\Start Menu\Programs\Visual Studio Code.lnk'); Write-Host 'TargetPath:' $lnk.TargetPath; Write-Host 'Arguments:' $lnk.Arguments"

REM ファイル / フォルダ右クリックの「Code で開く」を登録
reg add "HKLM\SOFTWARE\Classes\*\shell\VSCode\command" /ve /d "\"C:\Program Files\Microsoft VS Code\Code.exe\" --extensions-dir \"C:\ProgramData\vscode-extensions\" \"%1\"" /f
reg add "HKLM\SOFTWARE\Classes\Directory\shell\VSCode\command" /ve /d "\"C:\Program Files\Microsoft VS Code\Code.exe\" --extensions-dir \"C:\ProgramData\vscode-extensions\" \"%1\"" /f
reg add "HKLM\SOFTWARE\Classes\Directory\Background\shell\VSCode\command" /ve /d "\"C:\Program Files\Microsoft VS Code\Code.exe\" --extensions-dir \"C:\ProgramData\vscode-extensions\" \"%V\"" /f

REM --extensions-dir 付きで起動する code.cmd ラッパを作成
REM (%* を echo で書くと対話的 cmd で失われるため、PowerShell で [char]37+'*' を書き出す)
powershell -NoProfile -Command "$pct=[char]37; $q=[char]34; $c='@echo off'+[char]13+[char]10+$q+'C:\Program Files\Microsoft VS Code\bin\code.cmd'+$q+' --extensions-dir '+$q+'C:\ProgramData\vscode-extensions'+$q+' '+$pct+'*'+[char]13+[char]10; [IO.File]::WriteAllText('C:\ProgramData\vscode-extensions\vscode.cmd',$c,[Text.Encoding]::ASCII)"

REM 拡張機能のインストール
set "CODE=C:\Program Files\Microsoft VS Code\bin\code.cmd"
"%CODE%" --extensions-dir "C:\ProgramData\vscode-extensions" --uninstall-extension GitHub.copilot
"%CODE%" --extensions-dir "C:\ProgramData\vscode-extensions" --uninstall-extension GitHub.copilot-chat
"%CODE%" --extensions-dir "C:\ProgramData\vscode-extensions" --install-extension ms-python.python
"%CODE%" --extensions-dir "C:\ProgramData\vscode-extensions" --install-extension ms-python.vscode-pylance
"%CODE%" --extensions-dir "C:\ProgramData\vscode-extensions" --install-extension ms-python.debugpy
"%CODE%" --extensions-dir "C:\ProgramData\vscode-extensions" --install-extension MS-CEINTL.vscode-language-pack-ja
"%CODE%" --extensions-dir "C:\ProgramData\vscode-extensions" --install-extension saoudrizwan.claude-dev
"%CODE%" --extensions-dir "C:\ProgramData\vscode-extensions" --install-extension rust-lang.rust-analyzer
"%CODE%" --extensions-dir "C:\ProgramData\vscode-extensions" --install-extension tamasfe.even-better-toml
"%CODE%" --extensions-dir "C:\ProgramData\vscode-extensions" --install-extension anthropic.claude-code
"%CODE%" --extensions-dir "C:\ProgramData\vscode-extensions" --install-extension almenon.arepl
"%CODE%" --extensions-dir "C:\ProgramData\vscode-extensions" --list-extensions --show-versions
echo === セットアップ完了 ===
2. Python インタプリタの選択
同一マシンに複数の Python がインストールされている場合,VS Code で使用する Python 本体(インタプリタ:Python プログラムを解釈・実行するソフトウェア)を選択する必要がある.
- コマンドパレット(コマンド名で機能を呼び出す VS Code の入力欄)を開く(
Ctrl+Shift+P) Python: Select Interpreterと入力する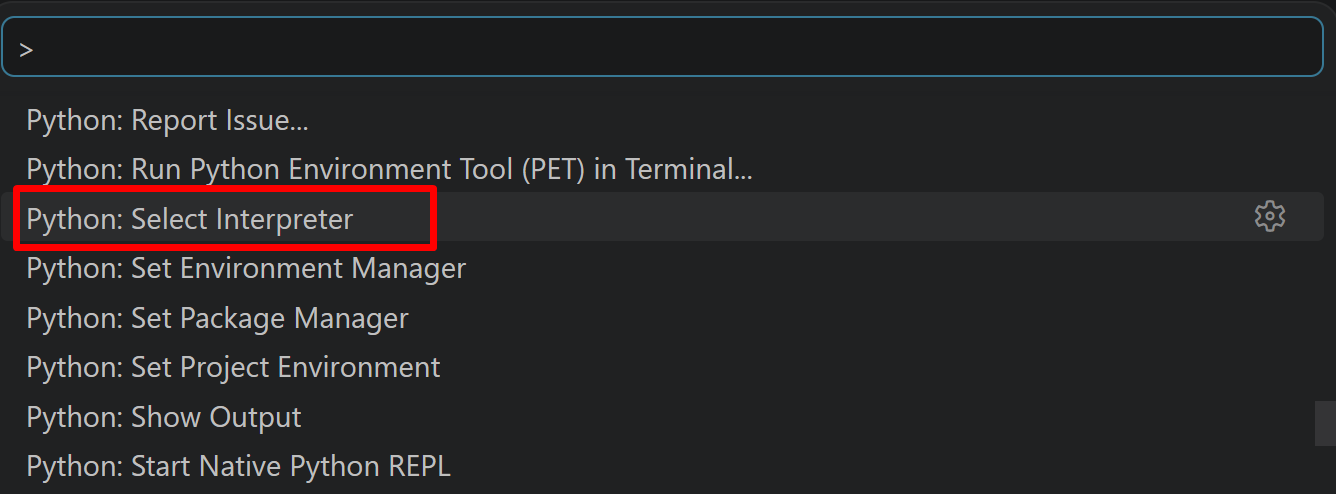
- 表示される一覧から,使用する Python(例:
C:\Program Files\Python312\python.exe)を選択する.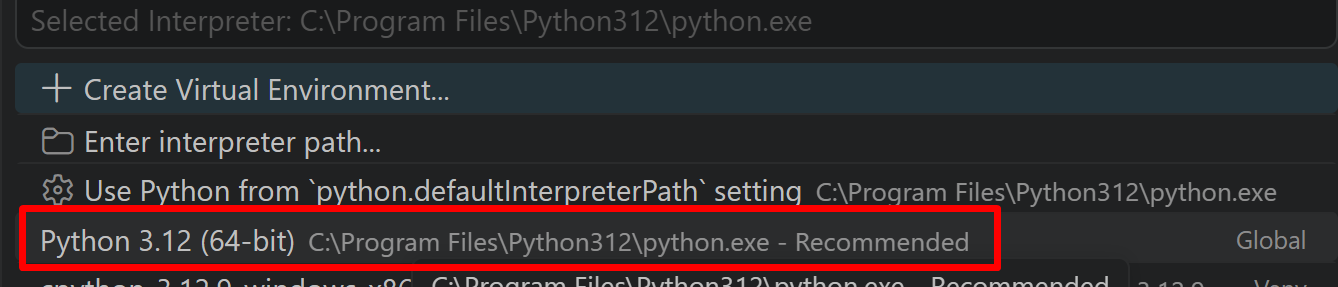
Python プログラム実行手順
[Windows での Python プログラム実行手順を見るには、ここをクリック]
Windows での Python 実行手順(Visual Studio Codeを使用)
プログラムファイルの作成と保存
- 左サイドバーの「エクスプローラー」アイコン(
Ctrl+Shift+E)をクリックする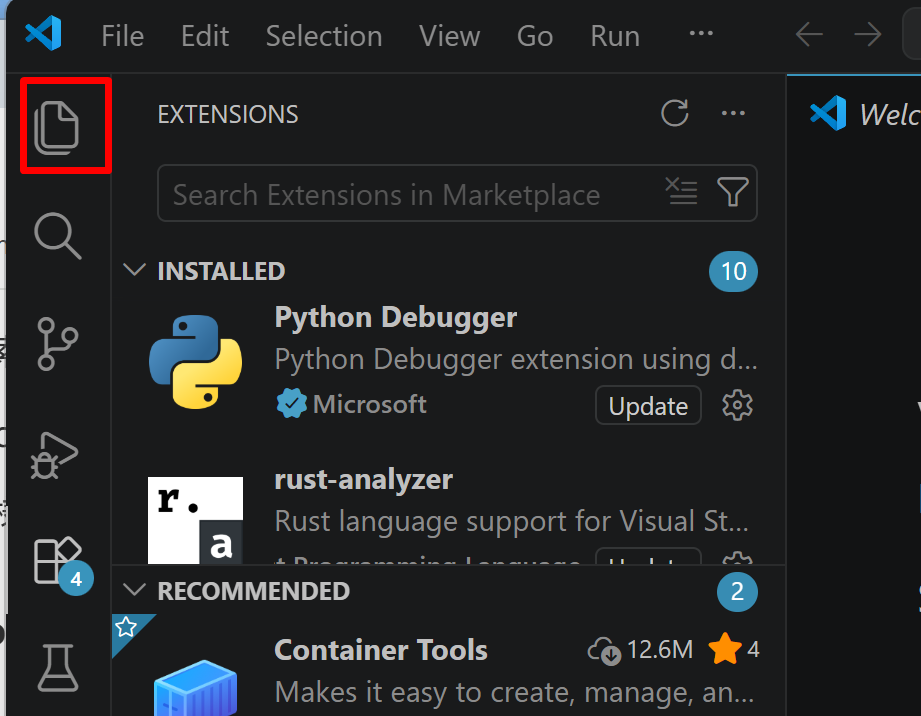
- 「NO FOLDER OPENED」(作業対象フォルダが未選択の状態)と表示される場合は,「Open Folder」をクリックし,プログラムを保存するフォルダを選択する
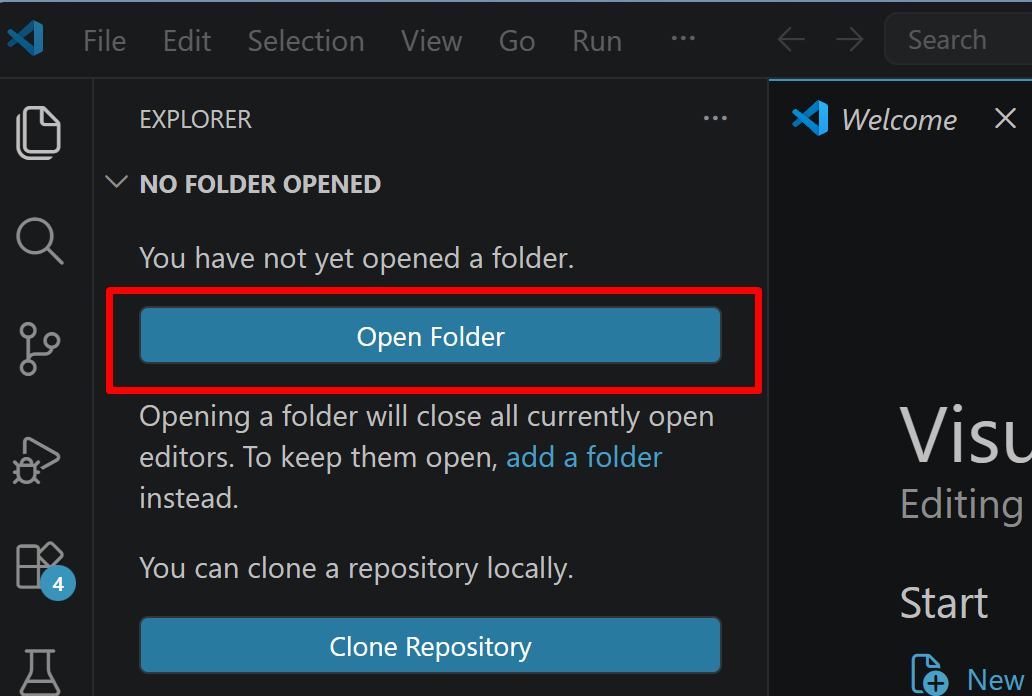
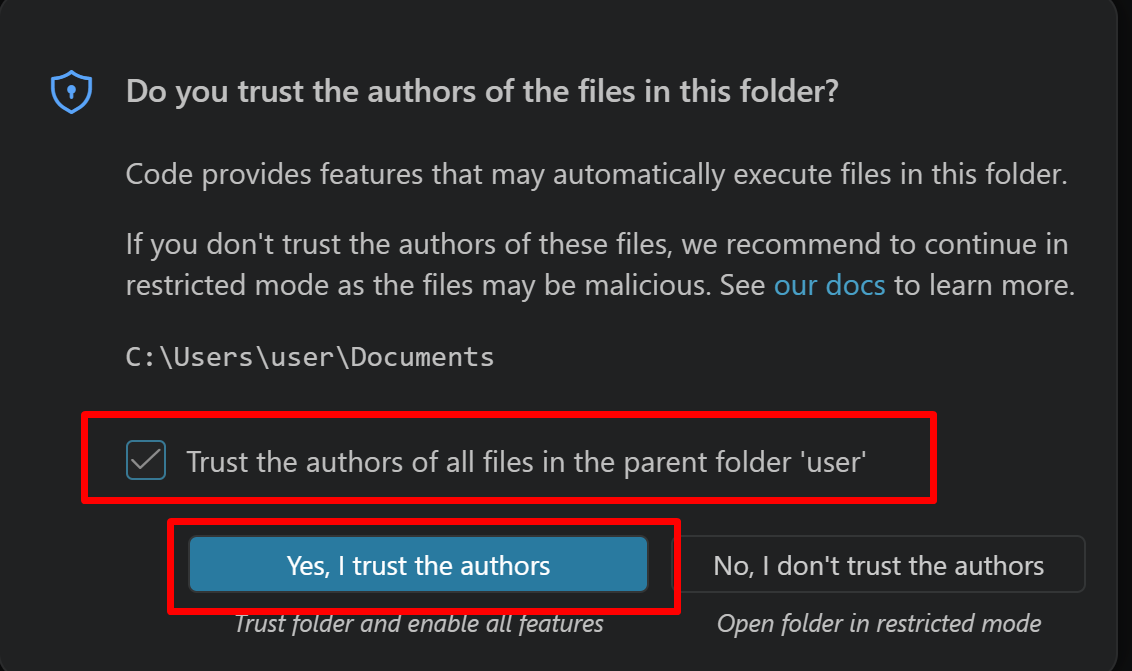
続いて「フォルダを信用するか」を確認する画面(フォルダ内のコードを実行してよいか確認する VS Code の仕組み)が表示されるので,チェックして Yes を選択する
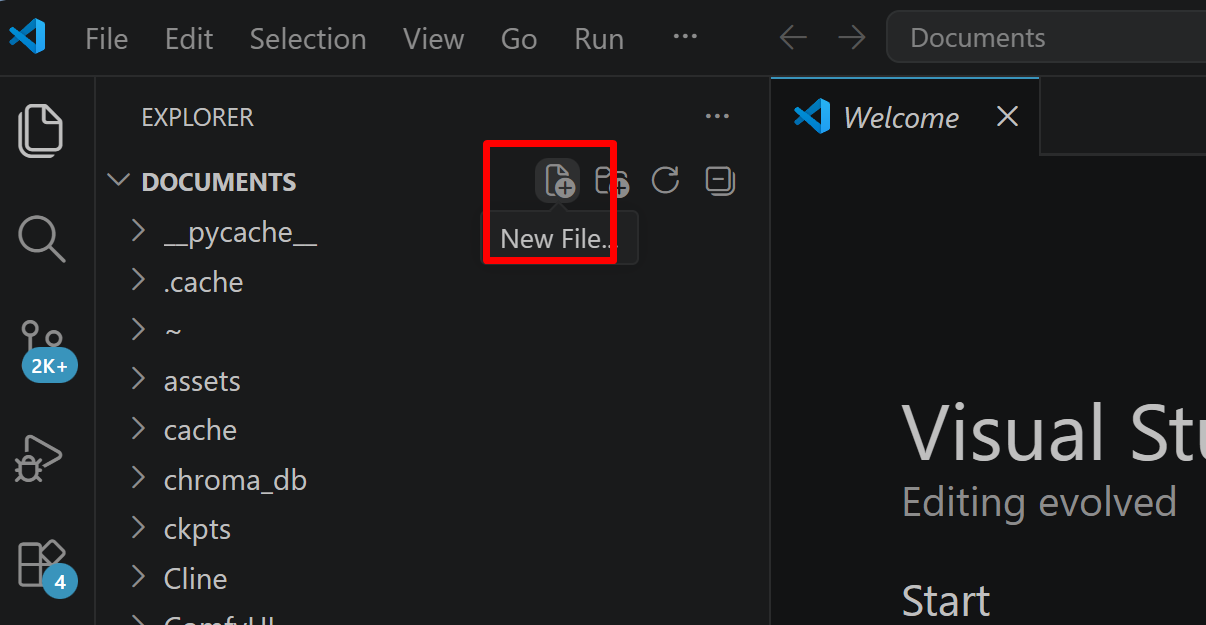
- フォルダ名の右側に表示される「新しいファイル」アイコンをクリックする
- ファイル名(例:
aitask.py.ファイル名は何でも良い)を入力しEnterを押す.拡張子は.py(Python ファイルを示す拡張子)とする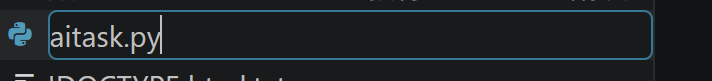
- 実行したいコードを選択し,
Ctrl+Cでコピーする.VS Code のエディタ領域にCtrl+Vで貼り付ける Ctrl+Sで保存する
プログラムの実行
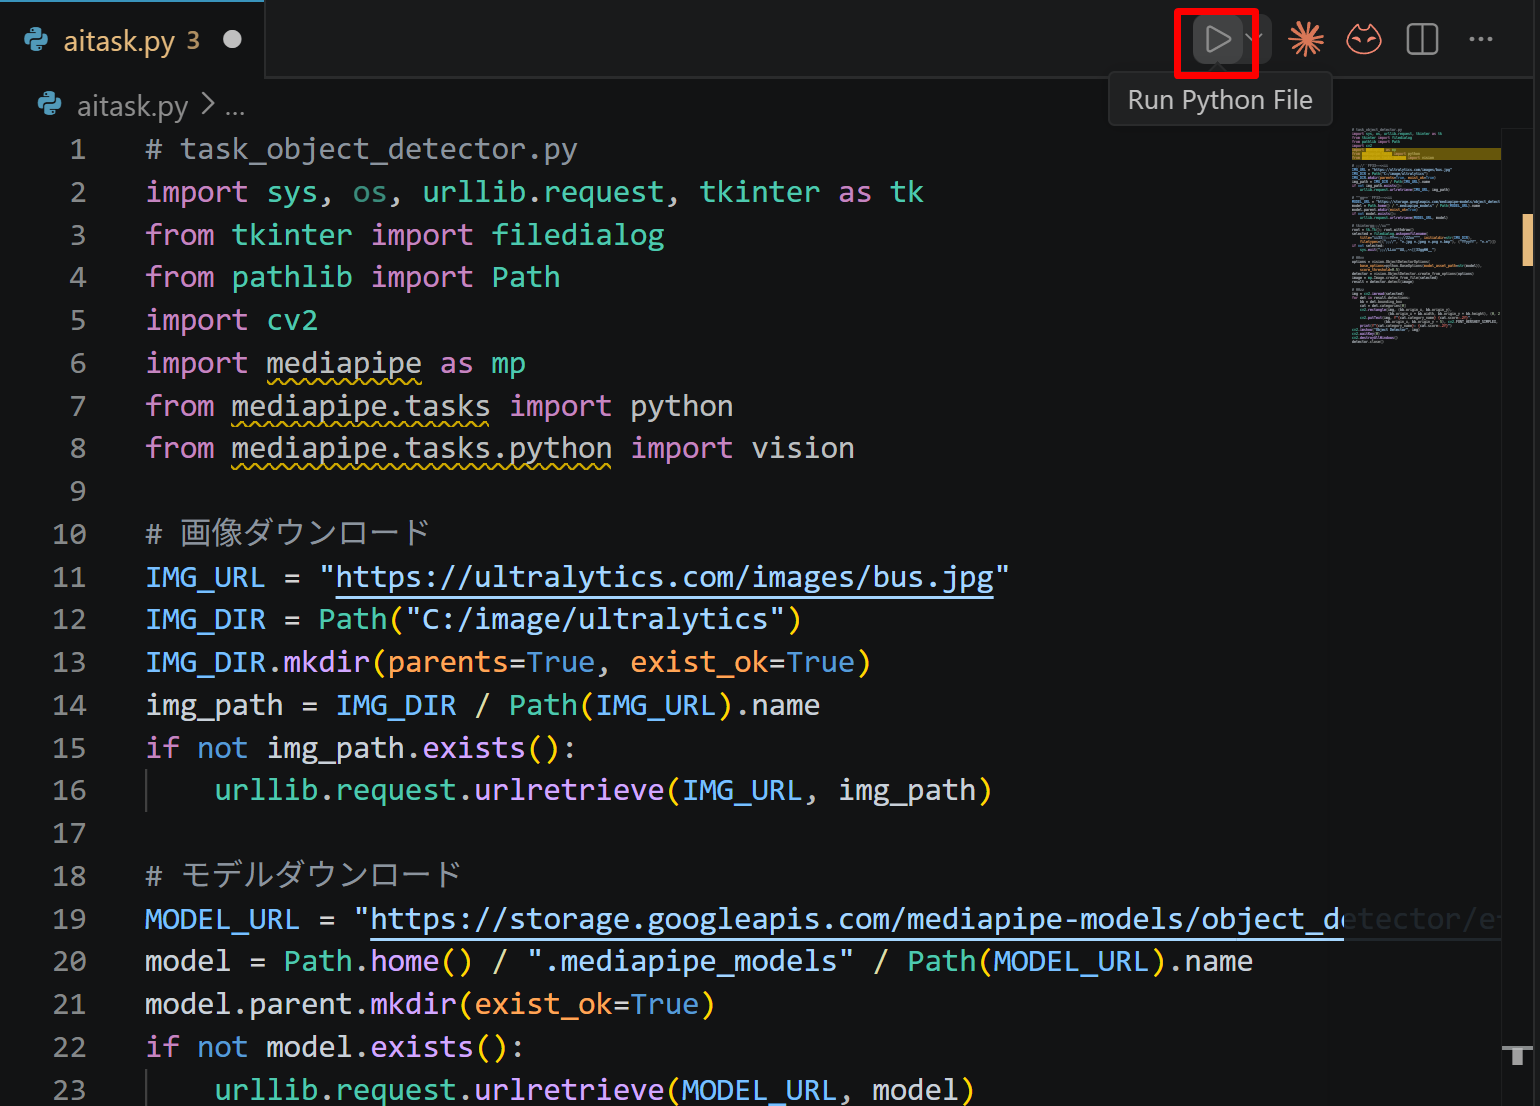
- エディタ右上の三角形「▷」アイコン(Run Python File:現在開いている Python ファイルを実行するボタン)をクリックする.または,エディタ上で右クリックし「ターミナルで Python ファイルを実行」を選択する
- VS Code 下部のターミナル(コマンドの入出力を表示する画面)に,実行結果(
print関数の出力等)が表示される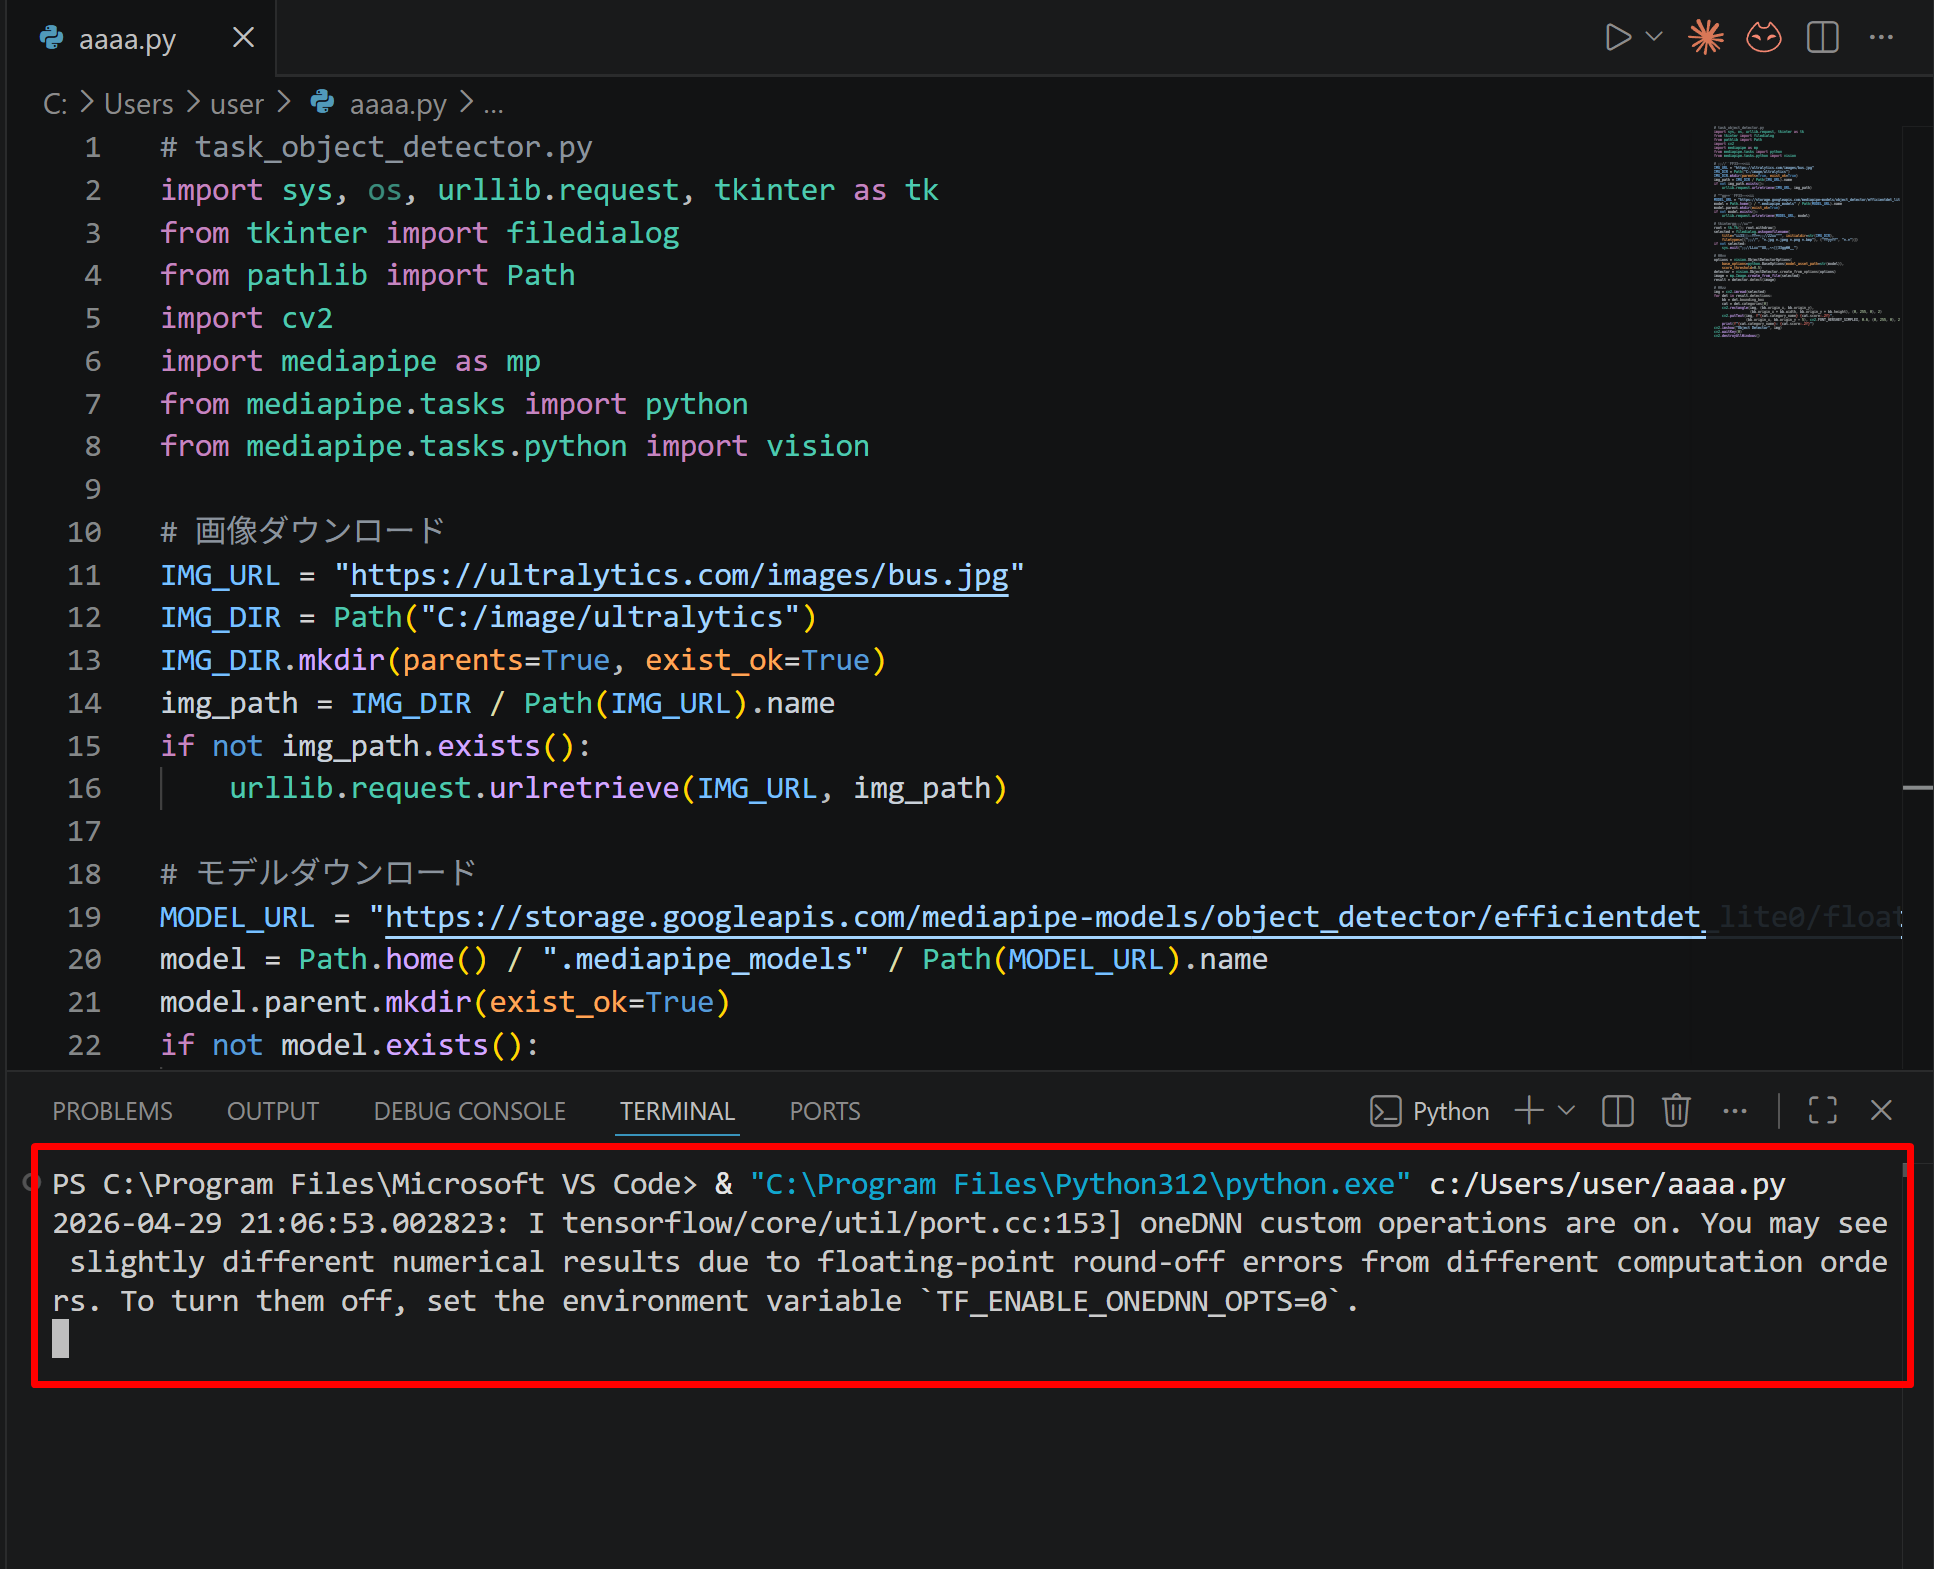
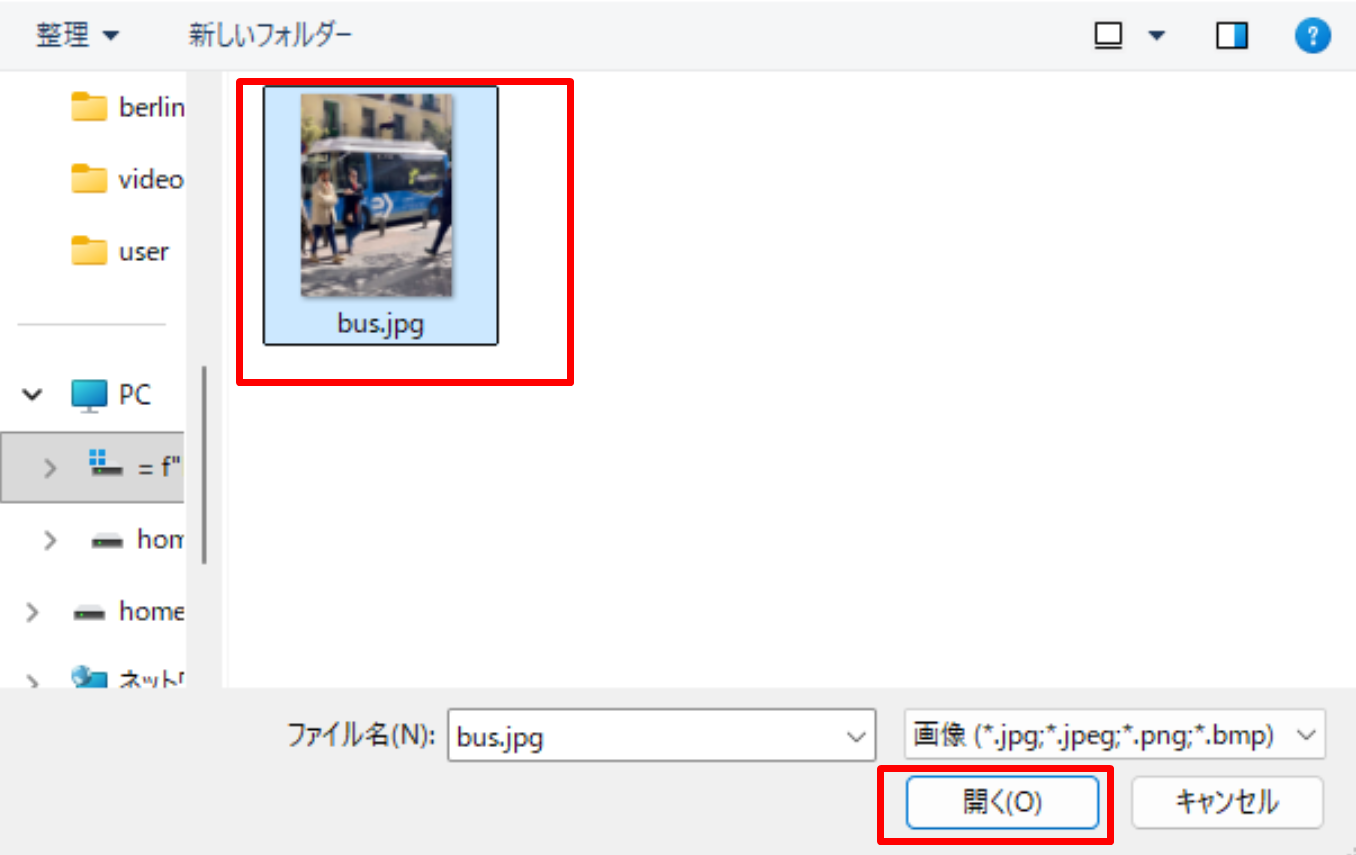
- tkinter(Python 標準の GUI ライブラリ)のファイル選択ダイアログを使うプログラムを実行した場合は,ダイアログが開くので対象画像を選択する
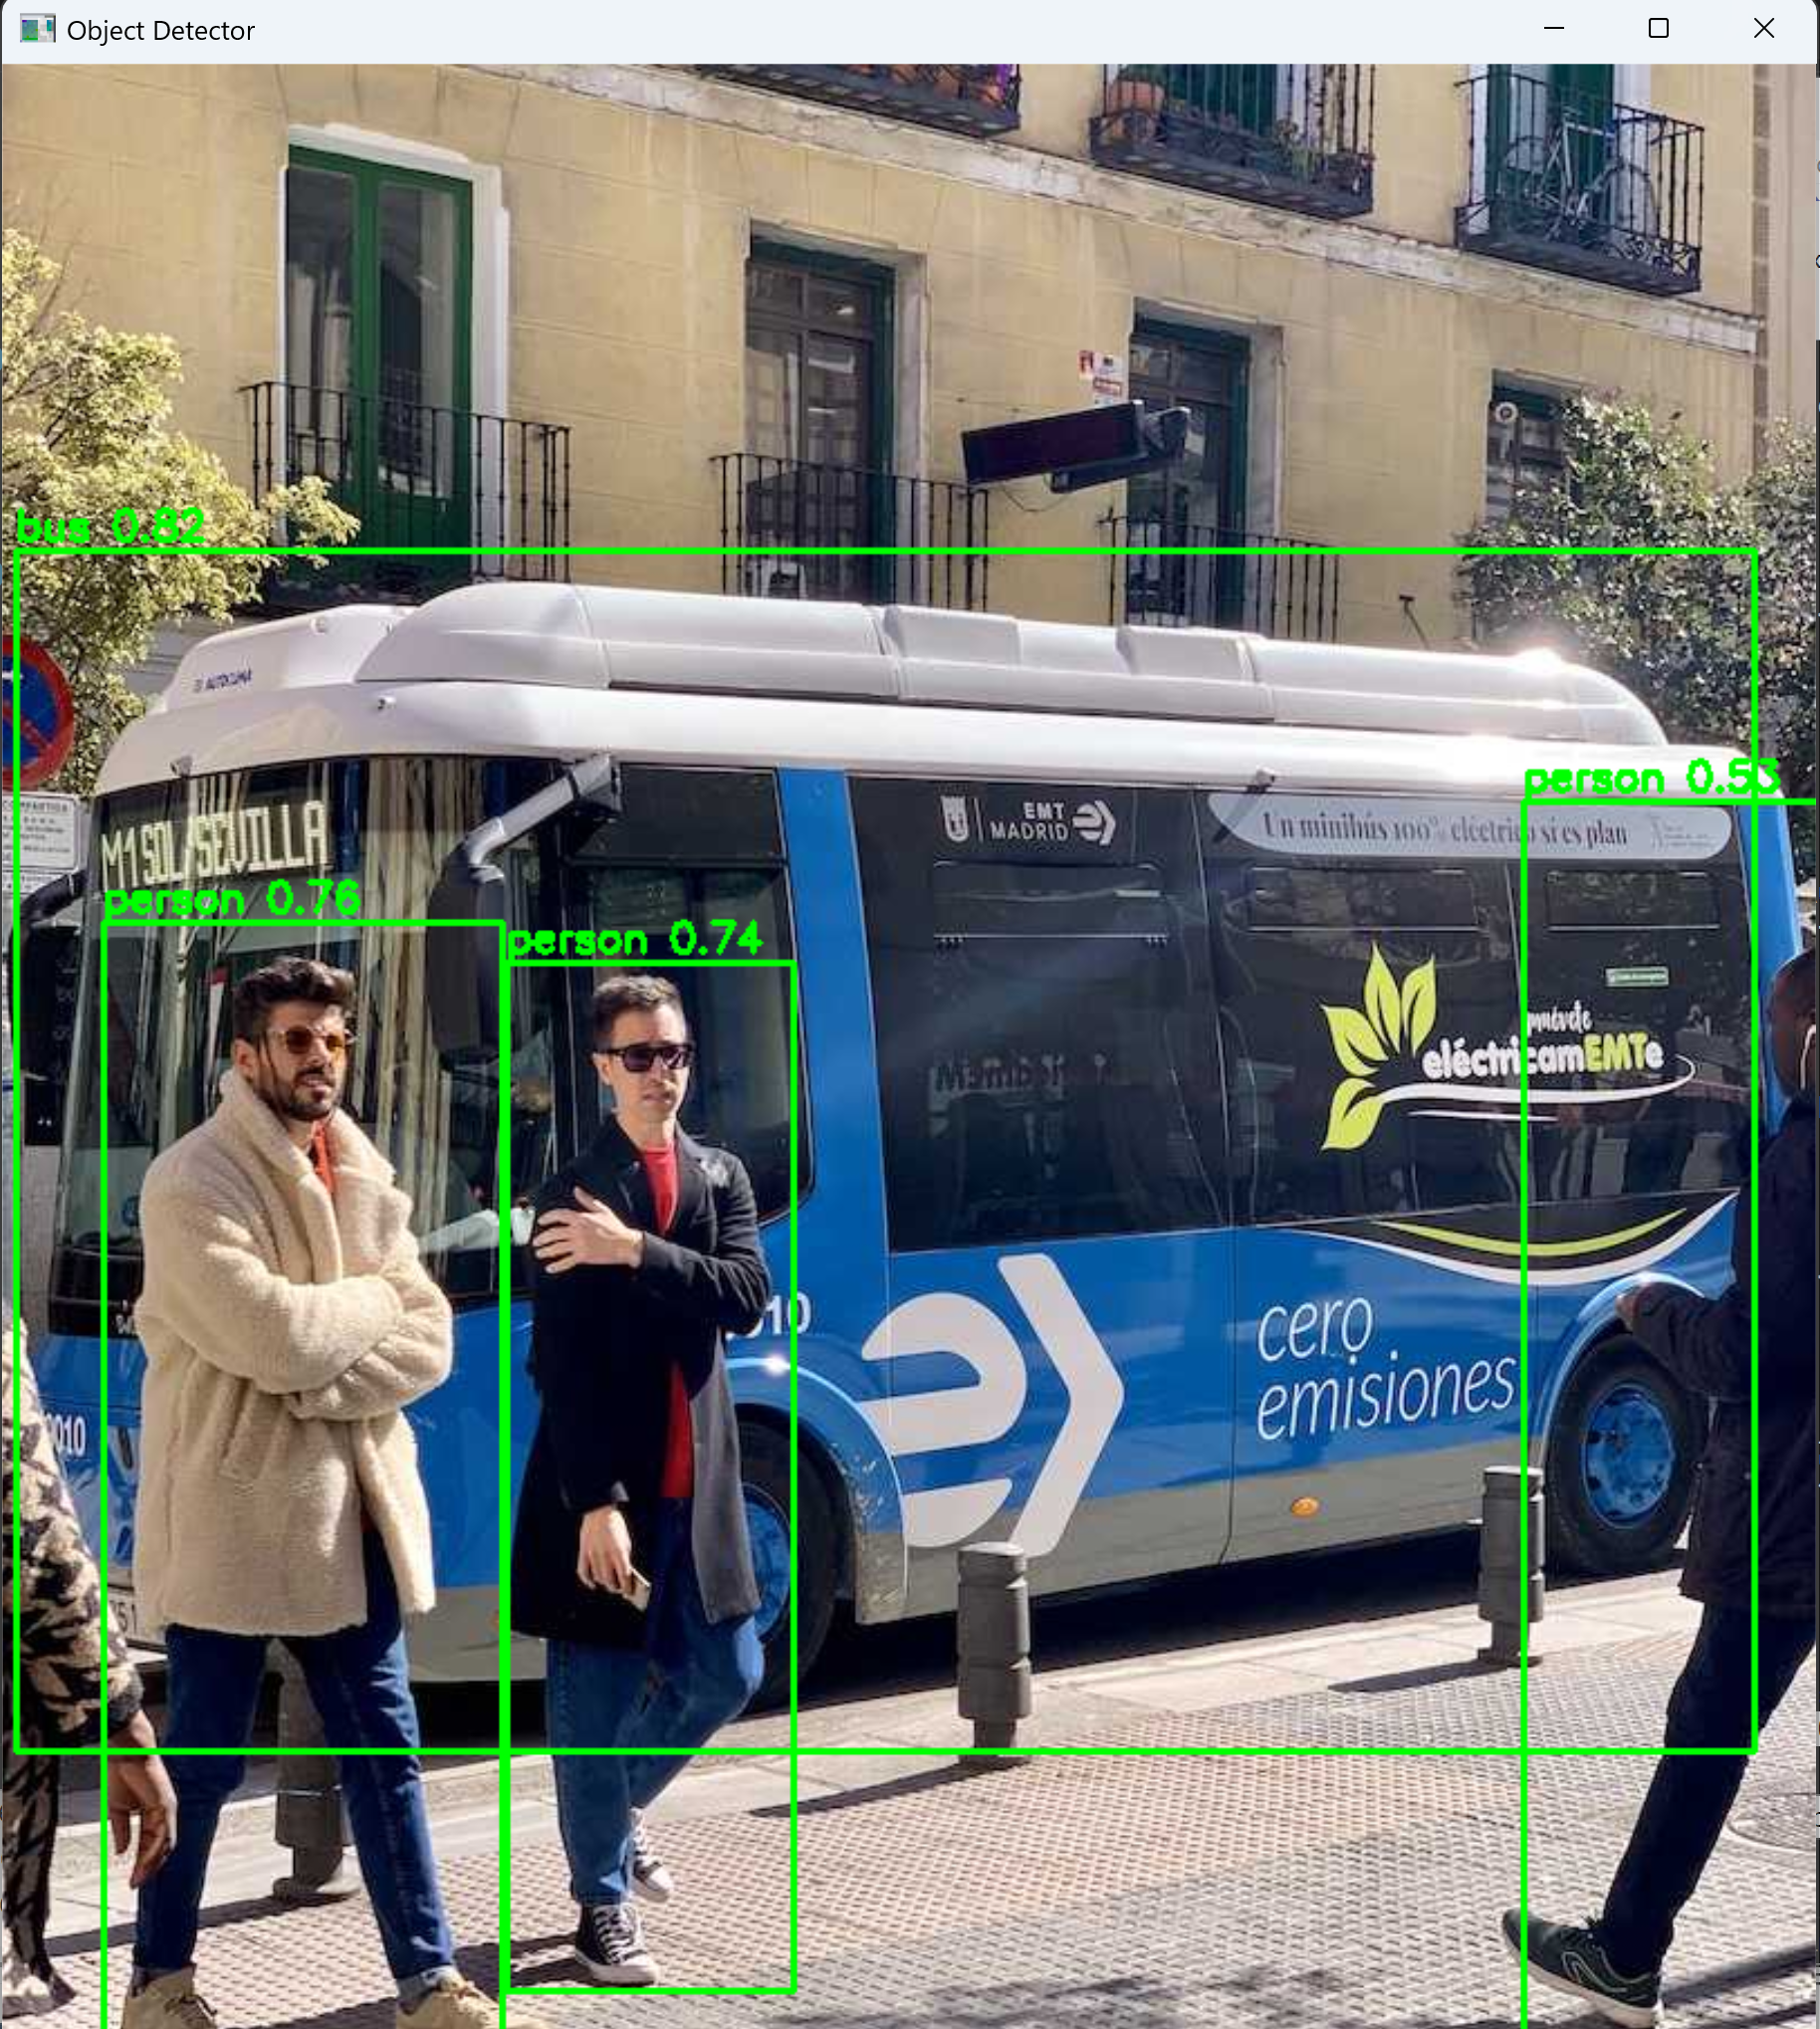
- VS Code 下部のターミナルで実行結果を確認する.OpenCV ウィンドウ(OpenCV が画像を表示するために開く専用ウィンドウ)が開いた場合はそちらも確認する.OpenCV ウィンドウは,マウスクリックでウィンドウをアクティブ(操作対象の状態)にしてからキーを押すと終了する
2. 必要なライブラリのインストール
管理者権限でコマンドプロンプトを起動する
(手順:Windowsキーまたはスタートメニュー → cmd と入力 → 右クリック → 「管理者として実行」)。
起動したコマンドプロンプトで以下を実行する。
pip install -U --no-user numpy matplotlib seaborn3. 概要・使い方・実行上の注意
プログラムでは以下のデータを使用する。
x = [1, 2, 3, 4, 5, 6, 7, 8, 9, 10, 11, 12, 13, 14, 15](float 型)
y = [22, 16, 10, 4, 4, 4, 4, 4, 4, 4, 24, 44, 64, 84, 104]
プログラムはこのデータ配列を3つの連続する区間に分割し,各区間で np.polyfit による1次の最小二乗近似を行う。すべての分割パターンについて残差の総和を計算し,残差が最小となる2つの端点(インデックス i, j)を総当たり探索で決定する。
残差の総和は,各区間で求めた近似直線の予測値と実測値の差を2乗して合計したものである。区間の点が2点だけのとき np.polyfit の full=True が返す残差は空配列になるため,本プログラムでは予測値から残差を直接計算する。
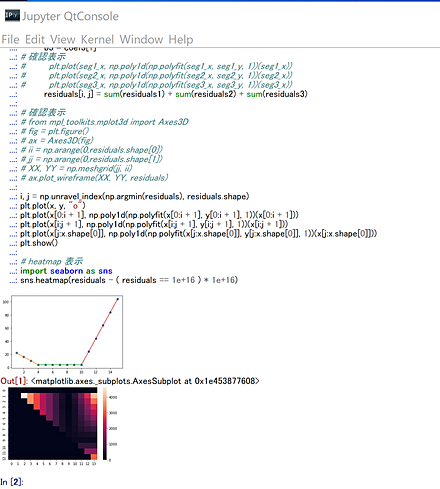
最適な端点が決まると,各線分の傾き・切片・区間をコンソールに表示し,散布図上にデータ点と3本の近似線分を描画する。各区間の端点には座標の注釈を付与する。
さらに,すべての (i, j) の組み合わせに対する残差をヒートマップとして可視化する。探索対象外のセル(無効な組み合わせ)は NaN として処理し,seaborn が自動的に除外する(マスクされて描画されない)。
4. 演習:データの並び x, y を3本の線分で近似する
テーマ名:3本の線分による区分線形近似と,残差ヒートマップの観察。
手順
- 必要なライブラリをインストールしていない場合は,管理者権限でコマンドプロンプトを起動する
(手順:Windowsキーまたはスタートメニュー →
cmdと入力 → 右クリック → 「管理者として実行」)。起動したコマンドプロンプトでpip install -U --no-user numpy matplotlib seabornを実行する。 - 下記のコードを実行する(メモ帳を用いる場合は a.py のようなファイル名で保存して実行)。文字コードは UTF-8 とする。
- コンソール出力を確認する。線分1,線分2,線分3 それぞれの傾き,切片,区間が表示される。
- 散布図を確認する。データ点が「o」マーカーで表示され,3本の近似線分が色分けされて描画される。グラフ上の各区間の端点には座標が注釈として表示される。
- ヒートマップを確認する。残差の分布が表示され,最小残差の位置が確認できる。
ヒント
- このデータは,前半が右下がり,中央がほぼ一定,後半が右上がりという3つの傾向に分かれている。
- ヒートマップの軸は端点のインデックス i, j に対応する。色が最も小さい値を示すセルが,残差を最小にする分割位置である。
考察ポイント
- コンソールに表示された3つの区間の境界が,データの傾向が切り替わる位置と一致しているかを読み取る。
- ヒートマップで残差が最小になる位置の近傍で,残差がどのように変化しているかを読み取る。
# 3本の線分で x, y を近似

import matplotlib.pyplot as plt
import numpy as np
import seaborn as sns

x = np.array([1, 2, 3, 4, 5, 6, 7, 8, 9, 10, 11, 12, 13, 14, 15], dtype=float)
y = np.array([22, 16, 10, 4, 4, 4, 4, 4, 4, 4, 24, 44, 64, 84, 104])


def ssr(xs, ys):
    c = np.polyfit(xs, ys, 1)
    return np.sum((ys - np.poly1d(c)(xs)) ** 2)


n = x.shape[0]
residuals = np.full((n - 2, n - 1), np.inf)

for i in range(1, n - 2):
    res1 = ssr(x[:i+1], y[:i+1])
    for j in range(i + 1, n - 1):
        residuals[i, j] = res1 + ssr(x[i:j+1], y[i:j+1]) + ssr(x[j:], y[j:])

i, j = np.unravel_index(np.argmin(residuals), residuals.shape)

# 最適な3区間の係数を求める
c1 = np.polyfit(x[:i+1], y[:i+1], 1)
c2 = np.polyfit(x[i:j+1], y[i:j+1], 1)
c3 = np.polyfit(x[j:], y[j:], 1)

# 各線分の傾きと切片,端点座標を表示
print(f"線分1: 傾き={c1[0]:.2f}, 切片={c1[1]:.2f}  区間 x=[{x[0]:.0f}, {x[i]:.0f}]")
print(f"線分2: 傾き={c2[0]:.2f}, 切片={c2[1]:.2f}  区間 x=[{x[i]:.0f}, {x[j]:.0f}]")
print(f"線分3: 傾き={c3[0]:.2f}, 切片={c3[1]:.2f}  区間 x=[{x[j]:.0f}, {x[n-1]:.0f}]")

# 散布図と近似線分の描画
plt.plot(x, y, "o", label="data")
plt.plot(x[:i+1], np.poly1d(c1)(x[:i+1]), label="seg 1")
plt.plot(x[i:j+1], np.poly1d(c2)(x[i:j+1]), label="seg 2")
plt.plot(x[j:], np.poly1d(c3)(x[j:]), label="seg 3")

# 端点の座標を注釈として表示
for idx in [0, i, j, n - 1]:
    yv = np.poly1d(c1 if idx <= i else c2 if idx <= j else c3)(x[idx])
    plt.annotate(f"({x[idx]:.0f}, {yv:.1f})", (x[idx], yv), textcoords="offset points", xytext=(0, 10), ha="center", fontsize=8)

plt.legend()
plt.xlabel("x")
plt.ylabel("y")
plt.show()

# ヒートマップ表示(無効値を NaN に置換)
heatmap_data = residuals.copy().astype(float)
heatmap_data[heatmap_data == np.inf] = np.nan
sns.heatmap(heatmap_data)
plt.xlabel("j")
plt.ylabel("i")
plt.show()
5. まとめ
- 区分線形近似:データの並び x, y を3本の線分で近似する手法である。データ配列を3つの区間に分割し,各区間で1次関数による最小二乗近似を行う。
- 端点の総当たり探索:区間の境界となる2つの端点(インデックス i, j)の全組み合わせについて残差の総和を計算し,残差が最小となる分割位置を決定する。
- 近似係数の算出と表示:
np.polyfitにより各区間の近似直線の傾きと切片を求め,コンソールに表示する。 - 散布図による可視化:データ点と3本の近似線分を散布図上に描画し,各端点に座標の注釈を付与する。
- ヒートマップによる残差分布の可視化:全 (i, j) の組み合わせに対する残差をヒートマップで表示し,最適な分割位置の近傍における残差の変化を確認できる。