R システムで最小全域木 (Minimum Spannning Tree) の作成(R システム,nnclust,igraph を使用)
前準備
R システムのインストール
【関連する外部ページ】
R システムの CRAN の URL: https://cran.r-project.org/
nnclust パッケージのインストール
R システムで,次のコマンドを実行し,インストールする. vignette で説明を表示.
このとき「Secure CRAN mirrors」のような,ミラーサイトの選択画面が出たときは「Japan」のものを選ぶ.
install.packages("nnclust")
vignette("nnclust")
この操作でインストールが行われる. R システムのパッケージのインストールについては、 必要に応じて「Rでのパッケージのインストール」のページを参考にしてください.
igraph パッケージのインストール
R システムで,次のコマンドを実行し,インストールする. vignette で説明を表示.
このとき「Secure CRAN mirrors」のような,ミラーサイトの選択画面が出たときは「Japan」のものを選ぶ.
install.packages("igraph")
vignette("igraph")
この操作でインストールが行われる. R システムのパッケージのインストールについては、 必要に応じて「Rでのパッケージのインストール」のページを参考にしてください.
MST(Minimum Spannning Tree) を作ってみる(nnclust を使用)
- データ {(1,1), (3,4), (4,3)}
X <- matrix( c(1, 3, 4, 1, 4, 3), nrow = 3)
plot(X)
mst <- mst(X)
segments( X[mst$from,1], X[mst$from,2], X[mst$to,1], X[mst$to,2], col="red")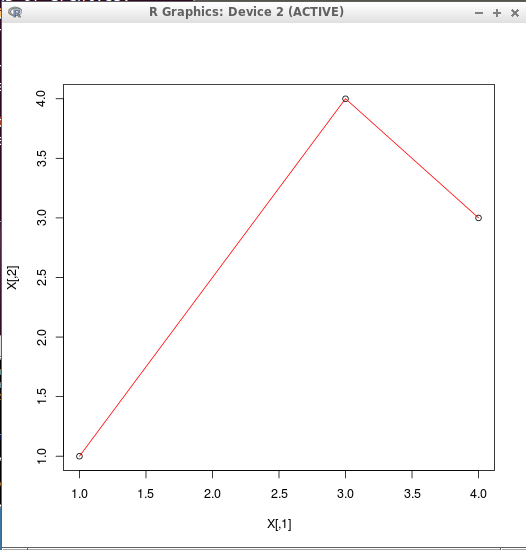
- Iris データセットの1列目と2列目
Y <-  matrix( c(iris[,1], iris[,2] ), ncol=2 )
plot(Y)
mst <- mst(Y)
segments( Y[mst$from,1], Y[mst$from,2], Y[mst$to,1], Y[mst$to,2], col="red")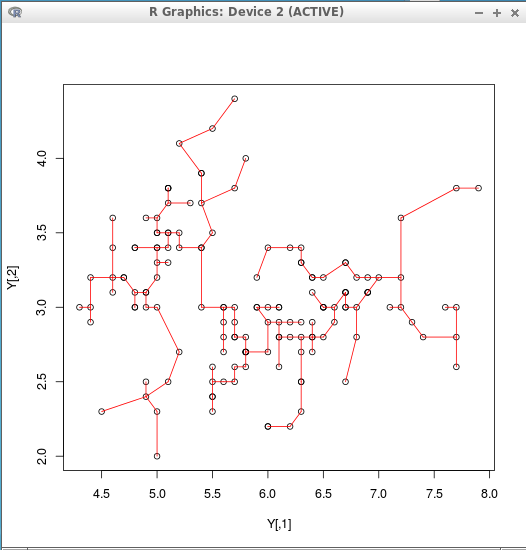
- Iris データセットの1列目と2列目と3列目
Y <-  matrix( c(iris[,1], iris[,2], iris[,3] ), ncol=3 )
plot(Y)
mst <- mst(Y)
segments( Y[mst$from,1], Y[mst$from,2], Y[mst$to,1], Y[mst$to,2], col="red")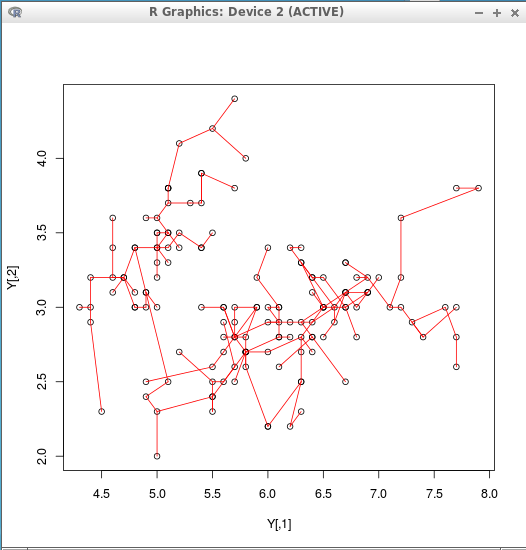
- Iris データセットの1列目と2列目と3列目と4列目
Y <-  matrix( c(iris[,1], iris[,2], iris[,3], iris[,4] ), ncol=4 )
plot(Y)
mst <- mst(Y)
segments( Y[mst$from,1], Y[mst$from,2], Y[mst$to,1], Y[mst$to,2], col="red")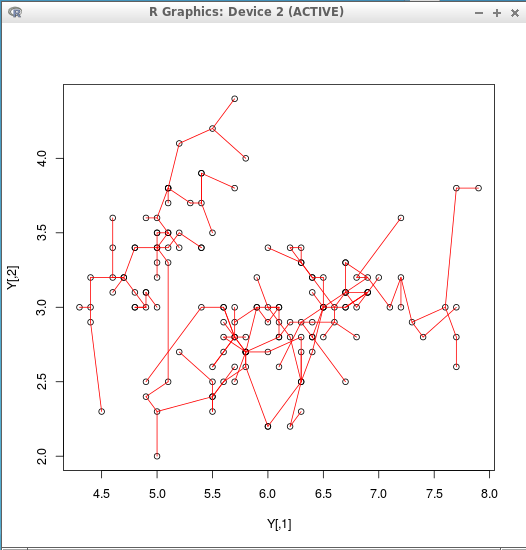
MST(Minimum Spannning Tree) を用いたクラスタリング
- しきい値: 0.1
Y <- matrix( c(iris[,1], iris[,2], iris[,3], iris[,4] ), ncol=4 ) c <- nncluster( scale(Y), threshold=0.1, give.up=1 ) clusterMember(c) plot(Y, col=clusterMember(c), pch=19 ) - しきい値: 0.2
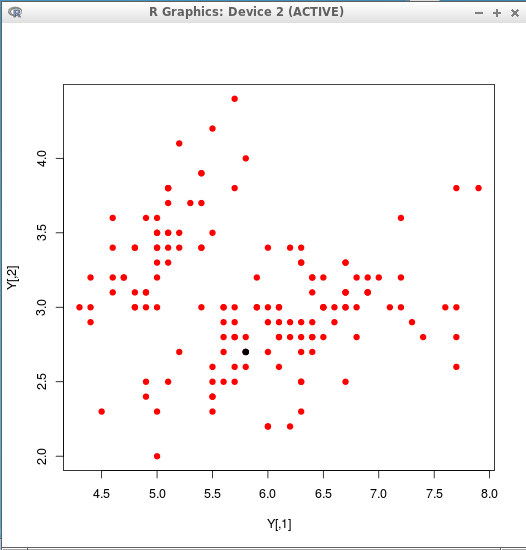
Y <- matrix( c(iris[,1], iris[,2], iris[,3], iris[,4] ), ncol=4 ) c <- nncluster( scale(Y), threshold=0.2, give.up=1 ) clusterMember(c) plot(Y, col=clusterMember(c), pch=19 ) - しきい値: 0.3
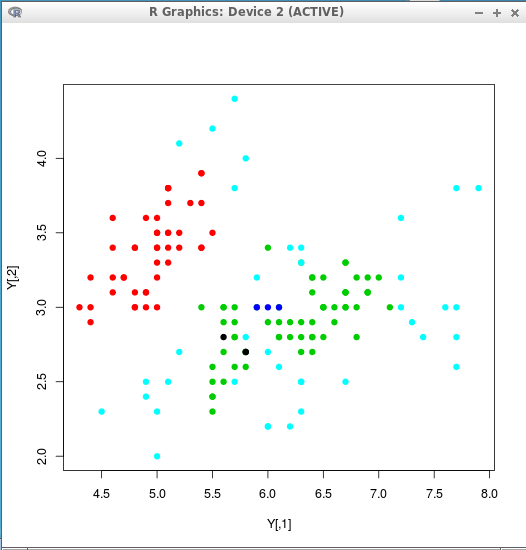
Y <- matrix( c(iris[,1], iris[,2], iris[,3], iris[,4] ), ncol=4 ) c <- nncluster( scale(Y), threshold=0.3, give.up=1 ) clusterMember(c) plot(Y, col=clusterMember(c), pch=19 ) - しきい値: 0.4
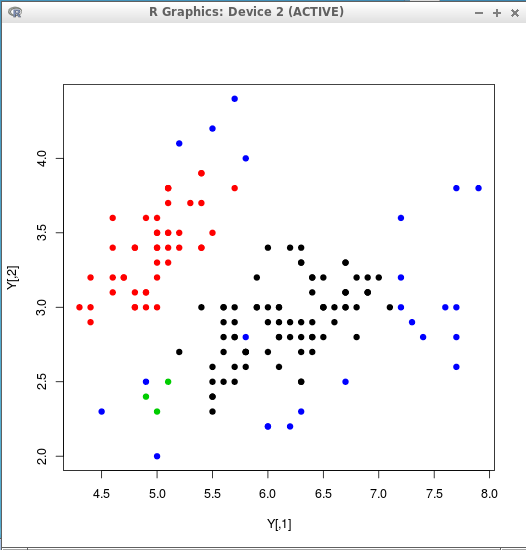
Y <- matrix( c(iris[,1], iris[,2], iris[,3], iris[,4] ), ncol=4 ) c <- nncluster( scale(Y), threshold=0.4, give.up=1 ) clusterMember(c) plot(Y, col=clusterMember(c), pch=19 ) - しきい値: 0.5
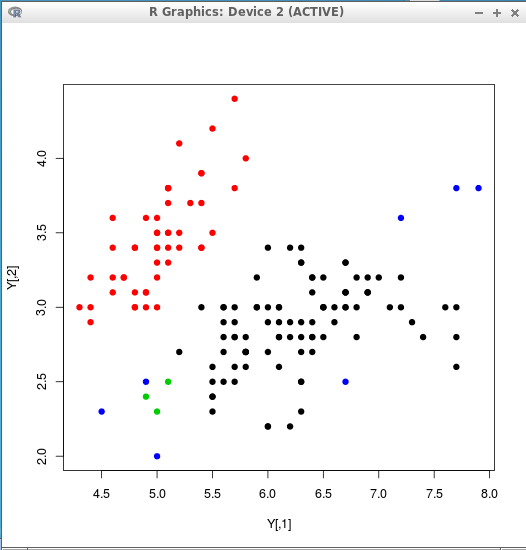
Y <-  matrix( c(iris[,1], iris[,2], iris[,3], iris[,4] ), ncol=4 )
c <- nncluster( scale(Y), threshold=0.5, give.up=1 )
clusterMember(c)
plot(Y, col=clusterMember(c), pch=19 )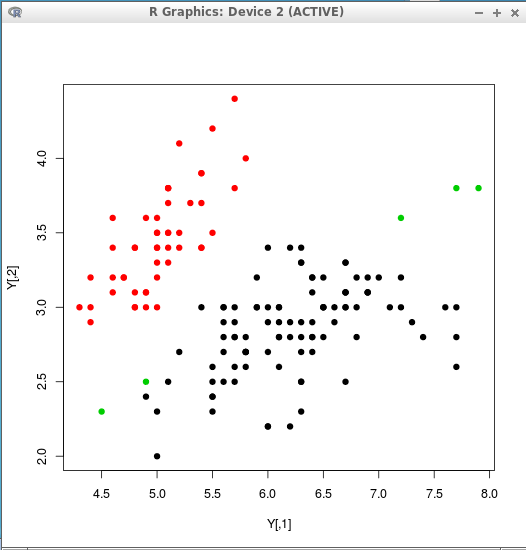
MST(Minimum Spannning Tree) を作ってみる(igraph を使用)
install.packages("igraph")
library(igraph)
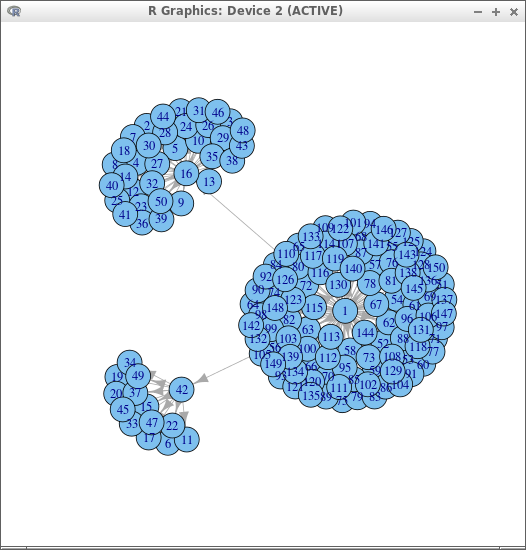
Y <-  matrix( c(iris[,1], iris[,2], iris[,3], iris[,4] ), ncol=4 )
plot(Y)
G <- graph.adjacency(dist(Y))
mst <- minimum.spanning.tree(G)
lay <- layout.reingold.tilford(G, mode="all")
plot(mst)
![[kaneko lab.]](https://www.kkaneko.jp/info/logo_png.png)