R システムの plot を用いた種々の散布図と折れ線グラフ
【要約】
Rシステムのplotを用いて散布図と折れ線グラフを描画する方法について.Rシステムをインストールし,plot関数を使用することで,散布図や折れ線グラフを作成できる.plot関数のオプションには,点や折れ線のスタイル,タイトルの追加,範囲設定,対数目盛り,グラフィックパラメータの調整などがある.また,CRANからのインストールや画像ファイルへの保存も可能である.さらに,ggplot2パッケージを使用することで,散布図や折れ線グラフ,ヒストグラムのバリエーションも実現できる.要点は,Rシステムのplot関数を利用して散布図や折れ線グラフを描画することができることであり,点や折れ線のスタイルやタイトルの追加,範囲設定などの調整が可能であり,ggplot2を活用することでさらなるグラフのバリエーションも得られる.
【関連する外部ページ】
R システムの CRAN の URL: https://cran.r-project.org/
【サイト内の関連ページ】
前準備
R システムのインストール
【関連する外部ページ】
R システムの CRAN の URL: https://cran.r-project.org/
【サイト内の関連ページ】
plot の要点
plot() 関数には次のような機能がある
- plot(X) : ベクトル X の散布図
- plot(X, Y) : ベクトル X, Y の散布図
- plot(m) : 2次元の行列 m に対する散布図
- plot(d) : データフレーム d の散布図
主なオプション
- type="p" : 点によるプロット(既定値)
- type="l" : 折れ線
- type="b" : 点と折れ線(点と折れ線が重ならない)
- type="c" : 折れ線(「点」があると思って,折れ線が「点」と重ならないように)
- type="o" : 点と折れ線の重ね合わせ
- main : メインタイトル (例)main="Main"
- sub : サブタイトル (例)sub="sub title"
- legend : 凡例
- xlab, ylab: X軸のタイトル、Y軸のタイトル (例) xlab="x", ylab="y"
- xlim, ylim: X軸の範囲、Y軸の範囲 (例) xlim=c(0,10), ylim=c(0,10)
- tmag: タイトル等の文字の大きさ (例) tmag=2
- asp: XYの比
- log="x", log="y", log="xy" : 対数目盛り
- panel.first=grid(0,0) : 補助線(格子状)
- lowess: 平滑化
平滑化の関数は,他にも,smooth.spline(), ksmooth(), supsmu() などが知られている.
- col: プロットする点や線の色 (例) col=1
- pch = 0 : 点の形を四角形にする
- pch = 1 : 点の形を丸にする(既定値)
- plot(X,Y,pch = ifelse(<条件>,番号,番号) : 条件により点の形を変える
- cex : 点の大きさ
- lty = 1 : 線を実線にする
- lty = 2 : 線を破線にする
- lty = 3 : 線を点線にする
- lty = 4 : 線を破線にする
- lty = 5 : 線を破線にする
- lwd : 線の太さ
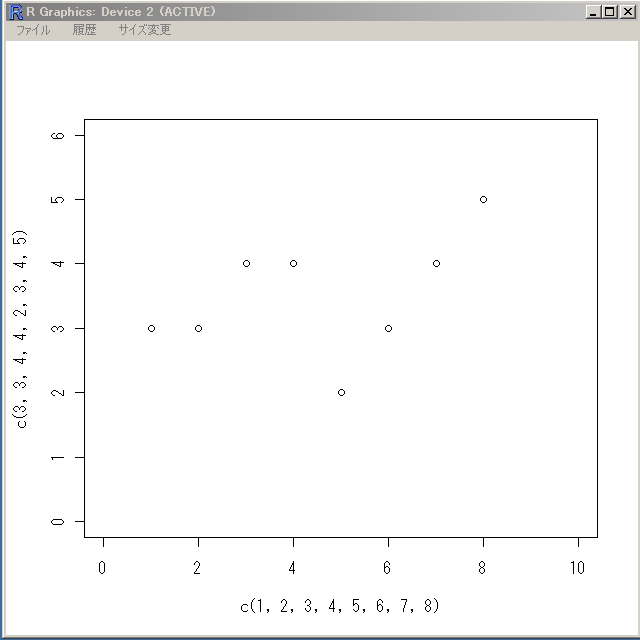
plot() 関数の実行例
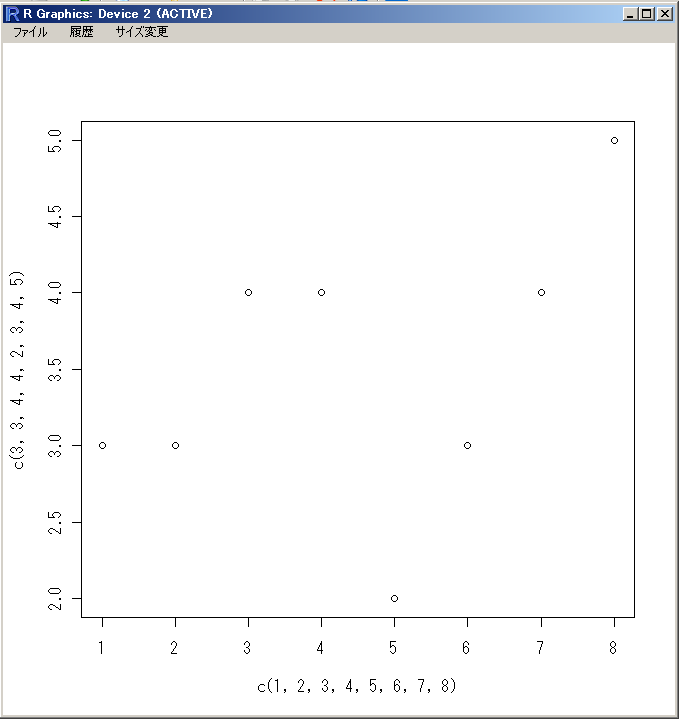
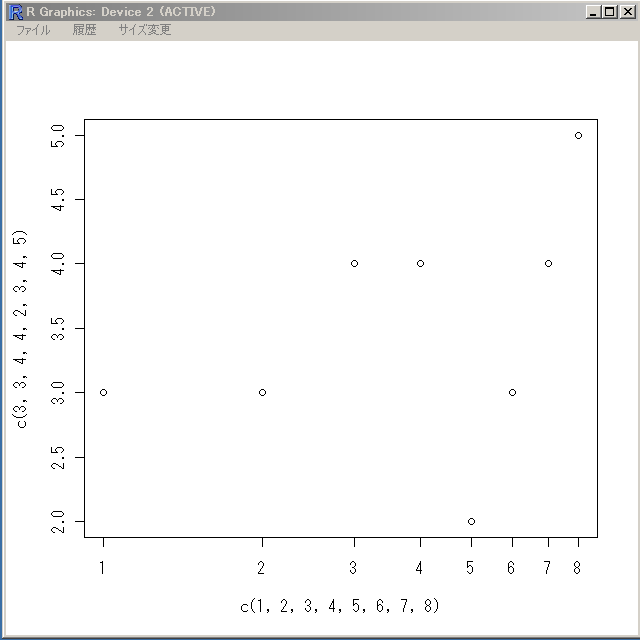
まずは,plot() 関数を使い,x, y 値を指定しての散布図の作成を行う.
x 値を格納したベクトル,y 値を格納したベクトルを引数として plot() 関数を使うと,散布図が描かれます.
plot( c(1, 2, 3, 4, 5, 6, 7, 8), c(3, 3, 4, 4, 2, 3, 4, 5) )

種々の散布図
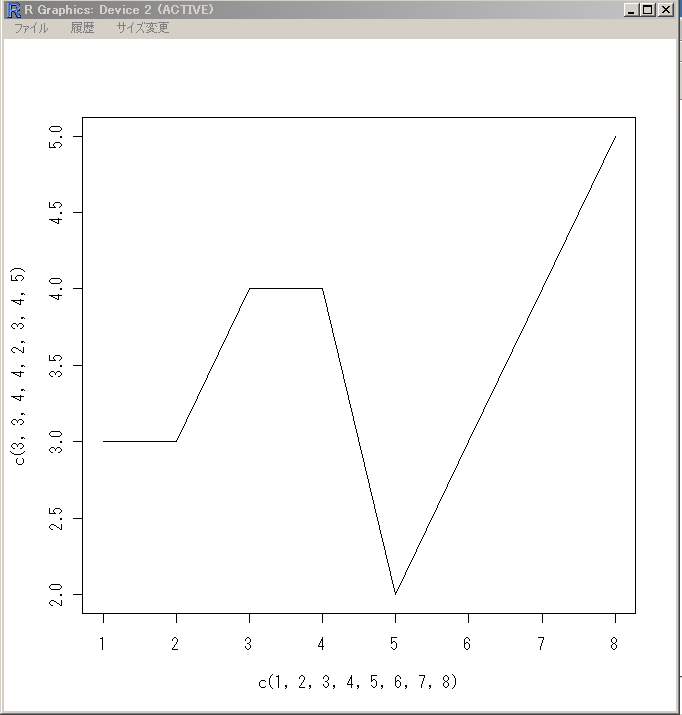
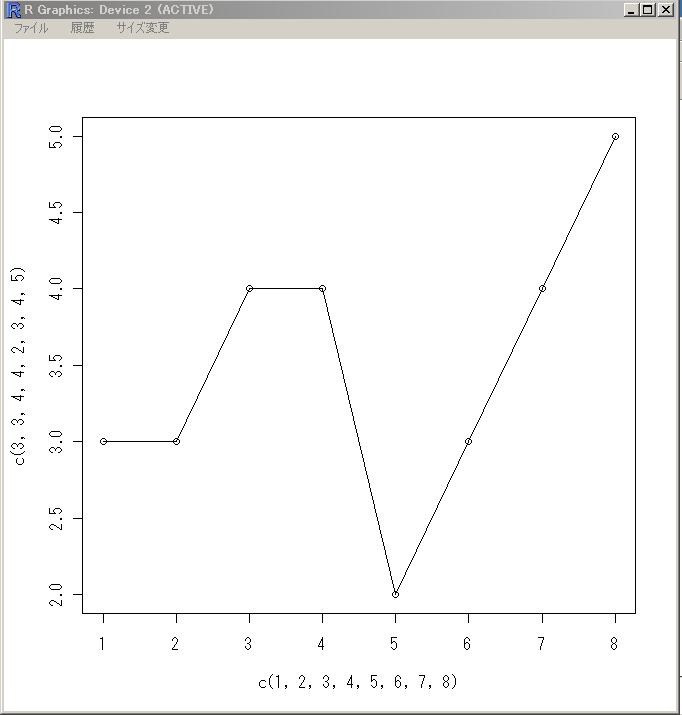
- 折れ線
plot( c(1, 2, 3, 4, 5, 6, 7, 8), c(3, 3, 4, 4, 2, 3, 4, 5), type="l" );
- 点と折れ線(点と折れ線が重ならない)
plot( c(1, 2, 3, 4, 5, 6, 7, 8), c(3, 3, 4, 4, 2, 3, 4, 5), type="b" );

- 折れ線(「点」があると思って,折れ線が「点」と重ならないように)
plot( c(1, 2, 3, 4, 5, 6, 7, 8), c(3, 3, 4, 4, 2, 3, 4, 5), type="c" );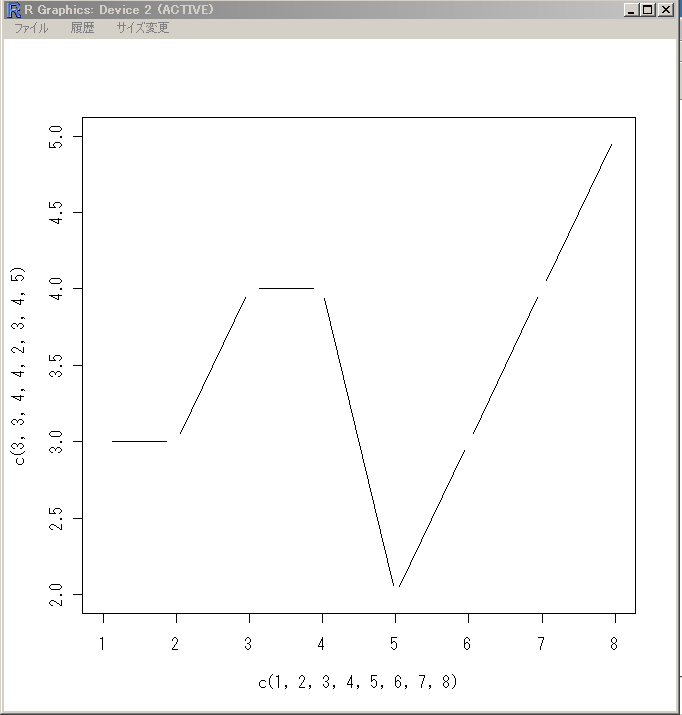
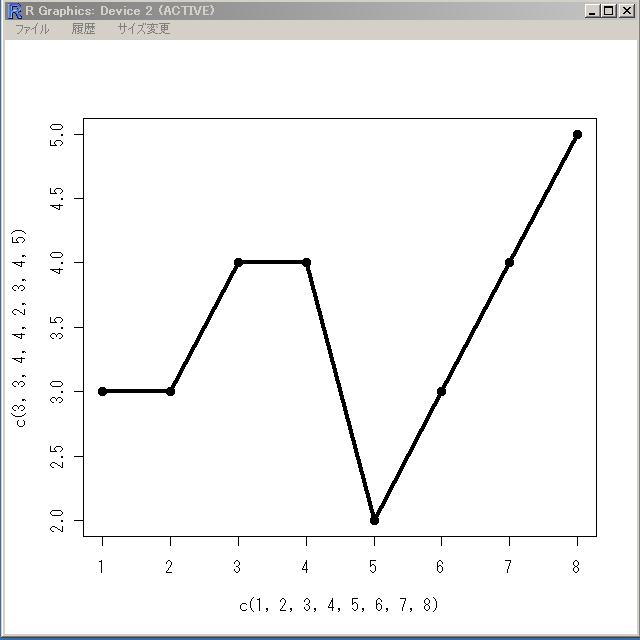
- 点と折れ線の重ね合わせ
plot( c(1, 2, 3, 4, 5, 6, 7, 8), c(3, 3, 4, 4, 2, 3, 4, 5), type="o" );
タイトル付け
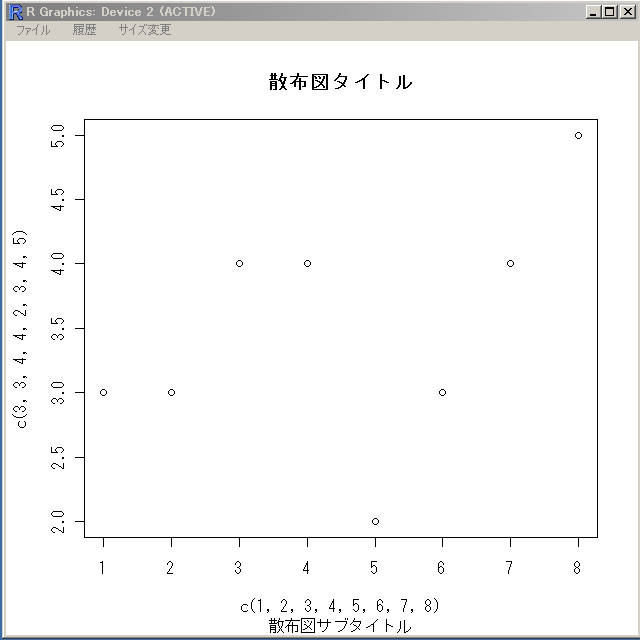
- メインタイトルとサブタイトル
main と sub を使用. メインタイトルはグラフの上に,サブタイトルはグラフの下に書かれる.
plot( c(1, 2, 3, 4, 5, 6, 7, 8), c(3, 3, 4, 4, 2, 3, 4, 5), main="散布図タイトル", sub="散布図サブタイトル" )
- 凡例
plot( c(1, 2, 3, 4, 5, 6, 7, 8), c(3, 3, 4, 4, 2, 3, 4, 5) )
legend(5, legend=c("x", "y"))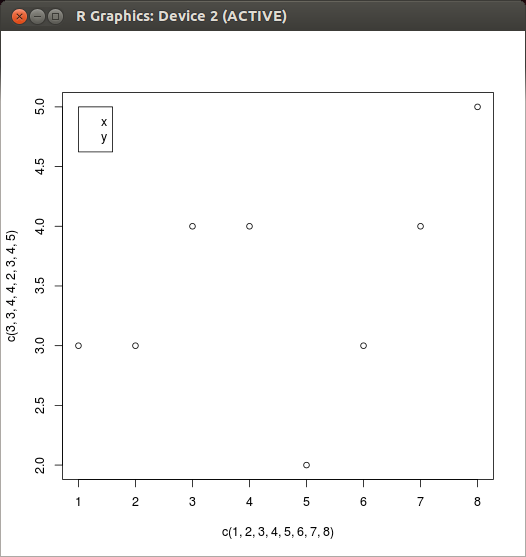
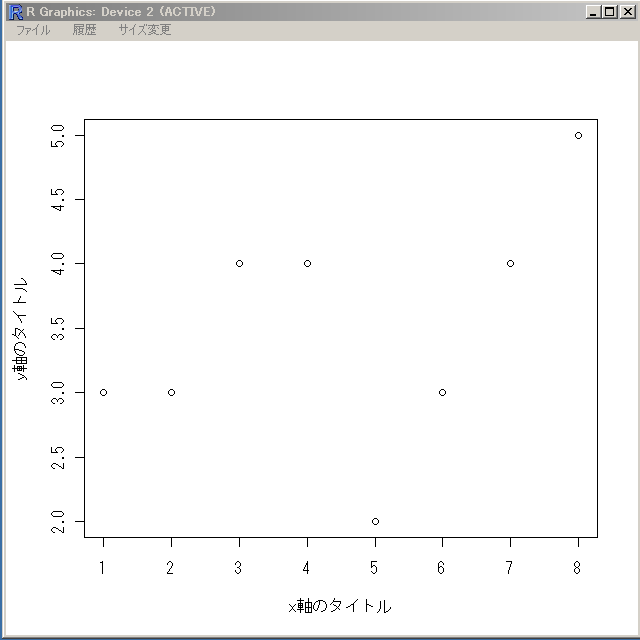
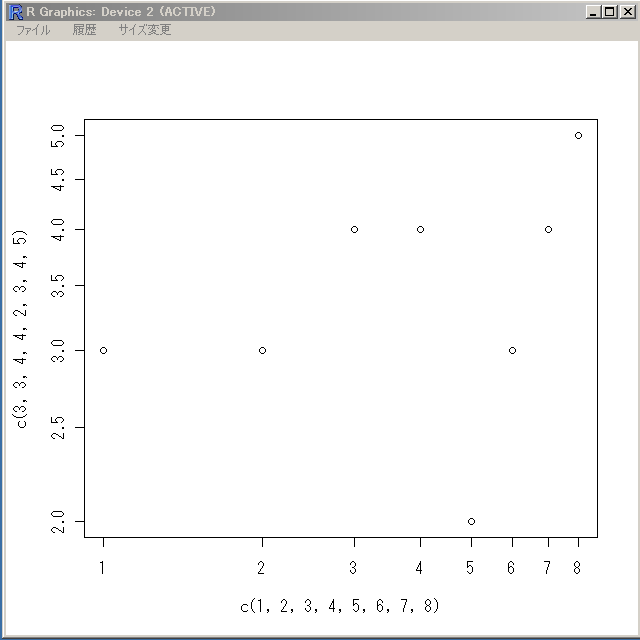
- x 軸のタイトルとy 軸のタイトル
xlab と ylab を使用.
plot( c(1, 2, 3, 4, 5, 6, 7, 8), c(3, 3, 4, 4, 2, 3, 4, 5), xlab="x軸のタイトル", ylab="y軸のタイトル" )
- タイトルとして数式を表示
expression オブジェクトを使う.
X <- seq(1, 5, length=100)
Y <- exp(-.5 * log( X^2 ) )
plot(X, Y, type="o", xlab="x", ylab=expression(e^{-frac(1,2) * {log[10](x)}^2}) )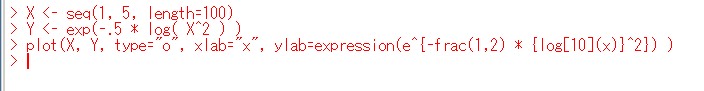
x,y値の範囲,対数目盛り,xy比
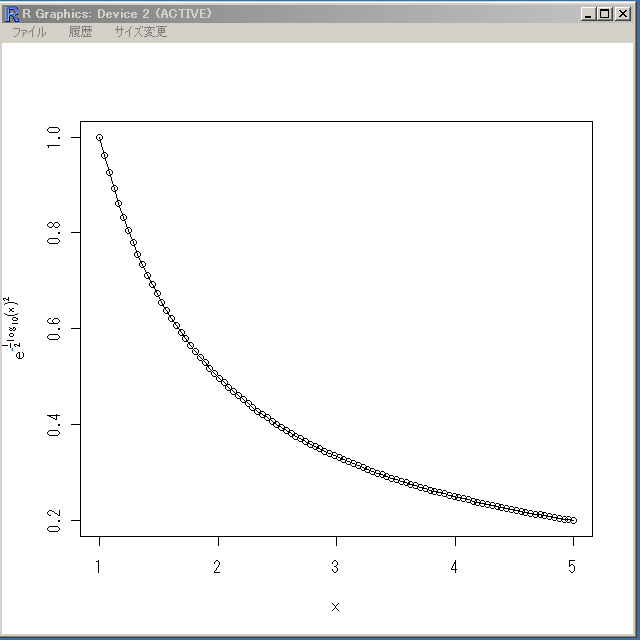
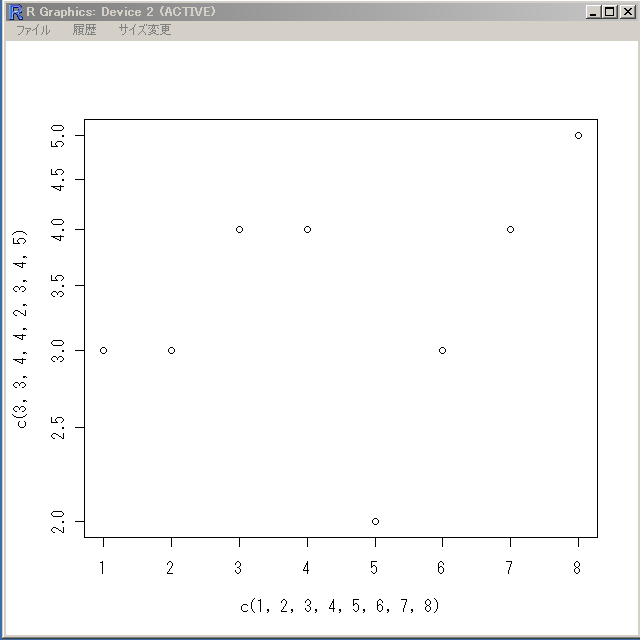
- x,y値の範囲
plot( c(1, 2, 3, 4, 5, 6, 7, 8), c(3, 3, 4, 4, 2, 3, 4, 5), xlim=c(0,10), ylim=c(0,6) )
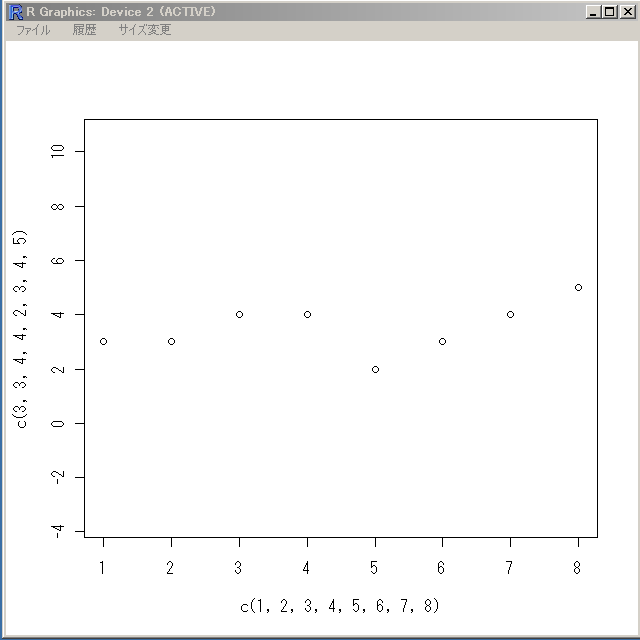
- xy比
plot( c(1, 2, 3, 4, 5, 6, 7, 8), c(3, 3, 4, 4, 2, 3, 4, 5), asp="0.4" )
- x軸を対数目盛り
plot( c(1, 2, 3, 4, 5, 6, 7, 8), c(3, 3, 4, 4, 2, 3, 4, 5), log="x" )
- y軸を対数目盛り
plot( c(1, 2, 3, 4, 5, 6, 7, 8), c(3, 3, 4, 4, 2, 3, 4, 5), log="y" )
- x, y軸を対数目盛り
plot( c(1, 2, 3, 4, 5, 6, 7, 8), c(3, 3, 4, 4, 2, 3, 4, 5), log="xy" )
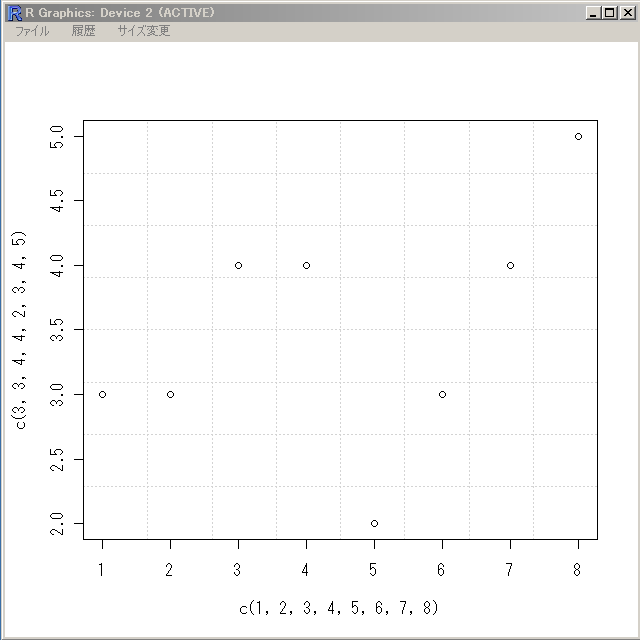
- 補助線 (格子状)
plot( c(1, 2, 3, 4, 5, 6, 7, 8), c(3, 3, 4, 4, 2, 3, 4, 5), panel.first=grid(8,8) )
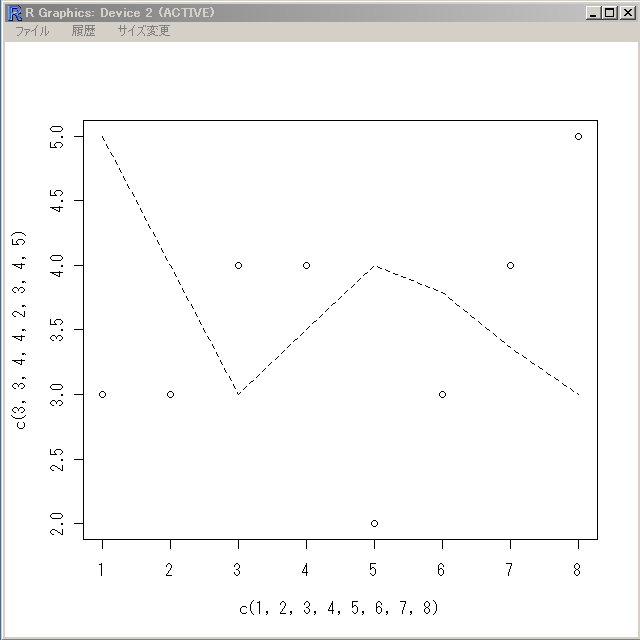
- 平滑化 (なめらかな折れ線)
plot( c(1, 2, 3, 4, 5, 6, 7, 8), c(3, 3, 4, 4, 2, 3, 4, 5),
        panel.first = lines(stats::lowess( c(8, 7, 6, 5, 4, 3, 2, 1), c(3, 3, 4, 4, 2, 3, 4, 5) ), lty="dashed") )
グラフィックパラメータ
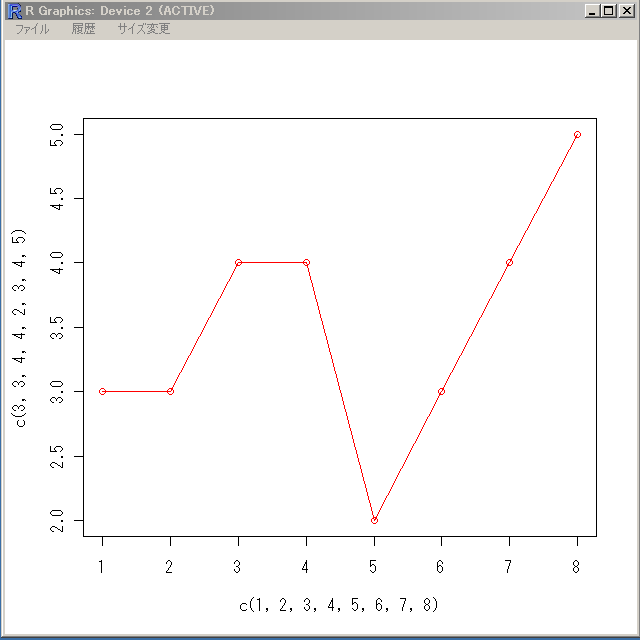
- 点や線の色
plot( c(1, 2, 3, 4, 5, 6, 7, 8), c(3, 3, 4, 4, 2, 3, 4, 5), type="o", col="red" )
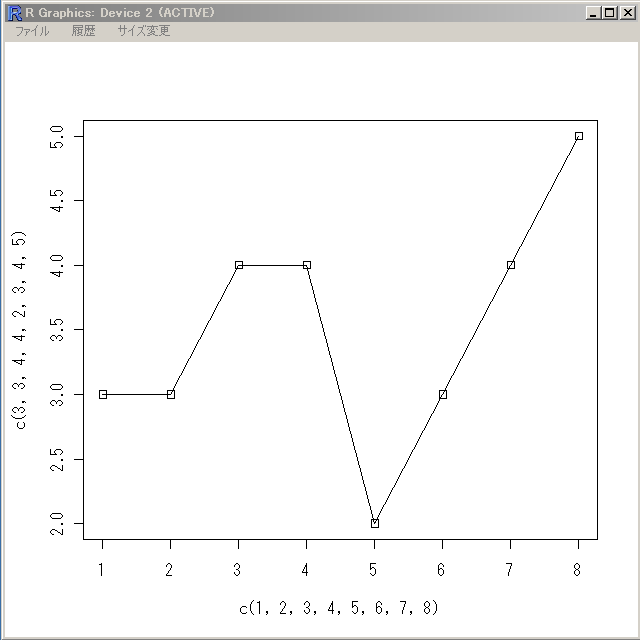
- 点の四角形に変更
plot( c(1, 2, 3, 4, 5, 6, 7, 8), c(3, 3, 4, 4, 2, 3, 4, 5), type="o", pch = 0 )
- 条件により点の形を変える
X = c(1, 2, 3, 4, 5, 6, 7, 8)
Y = c(3, 3, 4, 4, 2, 3, 4, 5)
plot(X,Y,pch = ifelse(Y<4, 0, 1))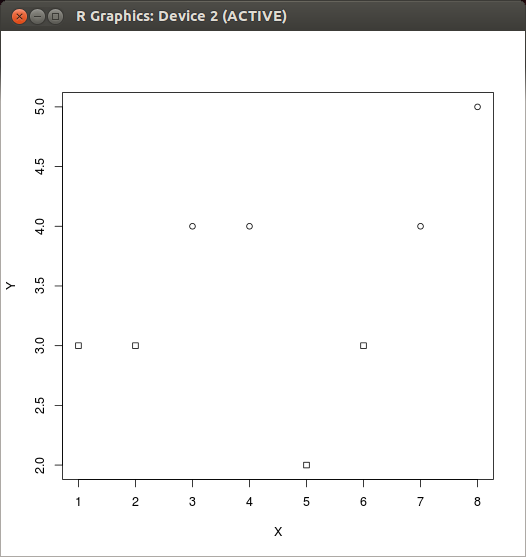
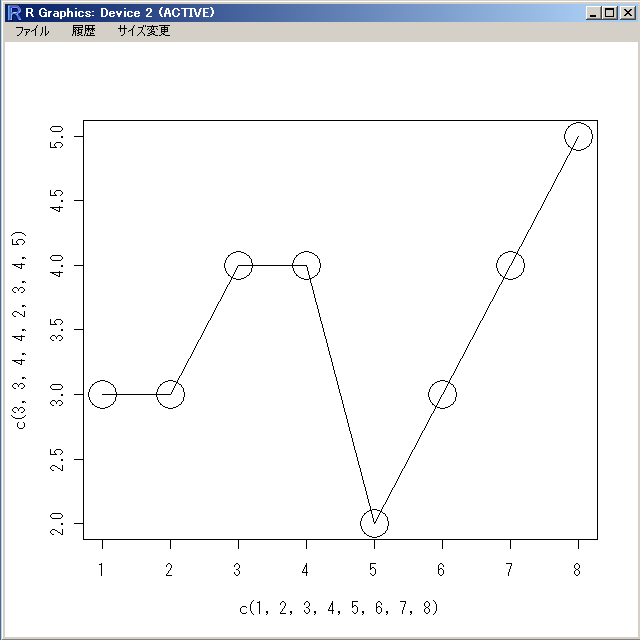
- 点の大きさ
plot( c(1, 2, 3, 4, 5, 6, 7, 8), c(3, 3, 4, 4, 2, 3, 4, 5), type="o", cex=4 )
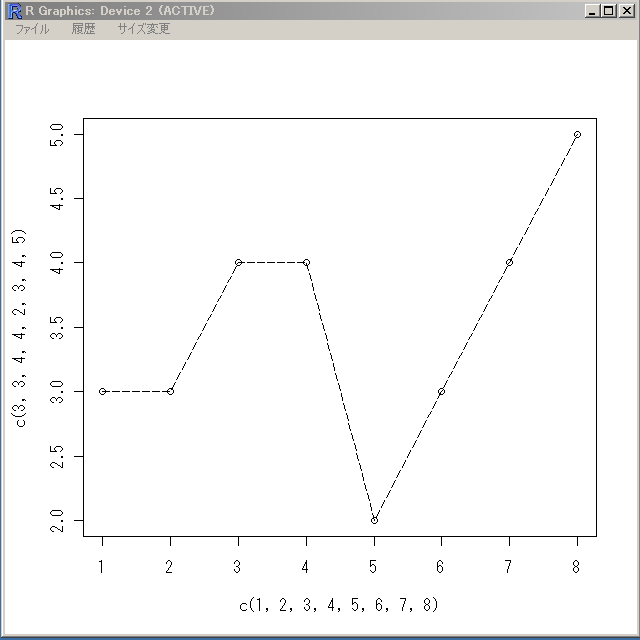
- 線のスタイル(破線)
plot( c(1, 2, 3, 4, 5, 6, 7, 8), c(3, 3, 4, 4, 2, 3, 4, 5), type="o", lty=2 )

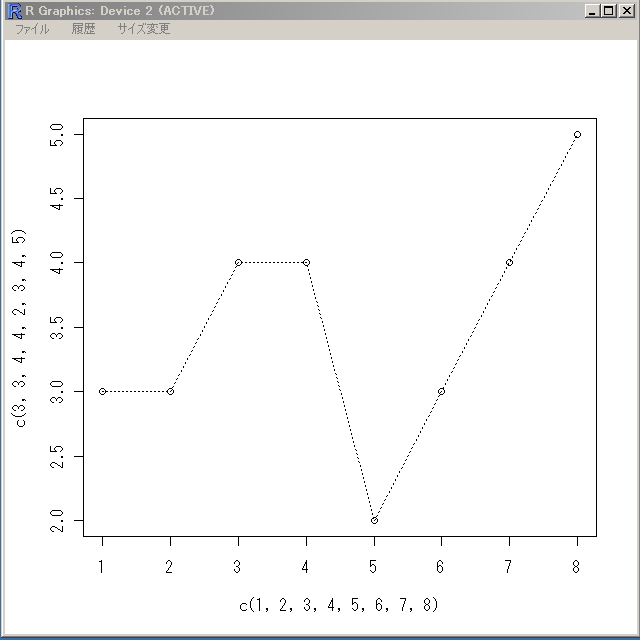
- 線のスタイル(点線)
plot( c(1, 2, 3, 4, 5, 6, 7, 8), c(3, 3, 4, 4, 2, 3, 4, 5), type="o", lty=3 )
- 線のスタイル(破線)
plot( c(1, 2, 3, 4, 5, 6, 7, 8), c(3, 3, 4, 4, 2, 3, 4, 5), type="o", lty=4 )

- 線のスタイル(破線)
plot( c(1, 2, 3, 4, 5, 6, 7, 8), c(3, 3, 4, 4, 2, 3, 4, 5), type="o", lty=5 )
- 線の太さ
plot( c(1, 2, 3, 4, 5, 6, 7, 8), c(3, 3, 4, 4, 2, 3, 4, 5), type="o", lwd=4 )